sndl Investor Presentation
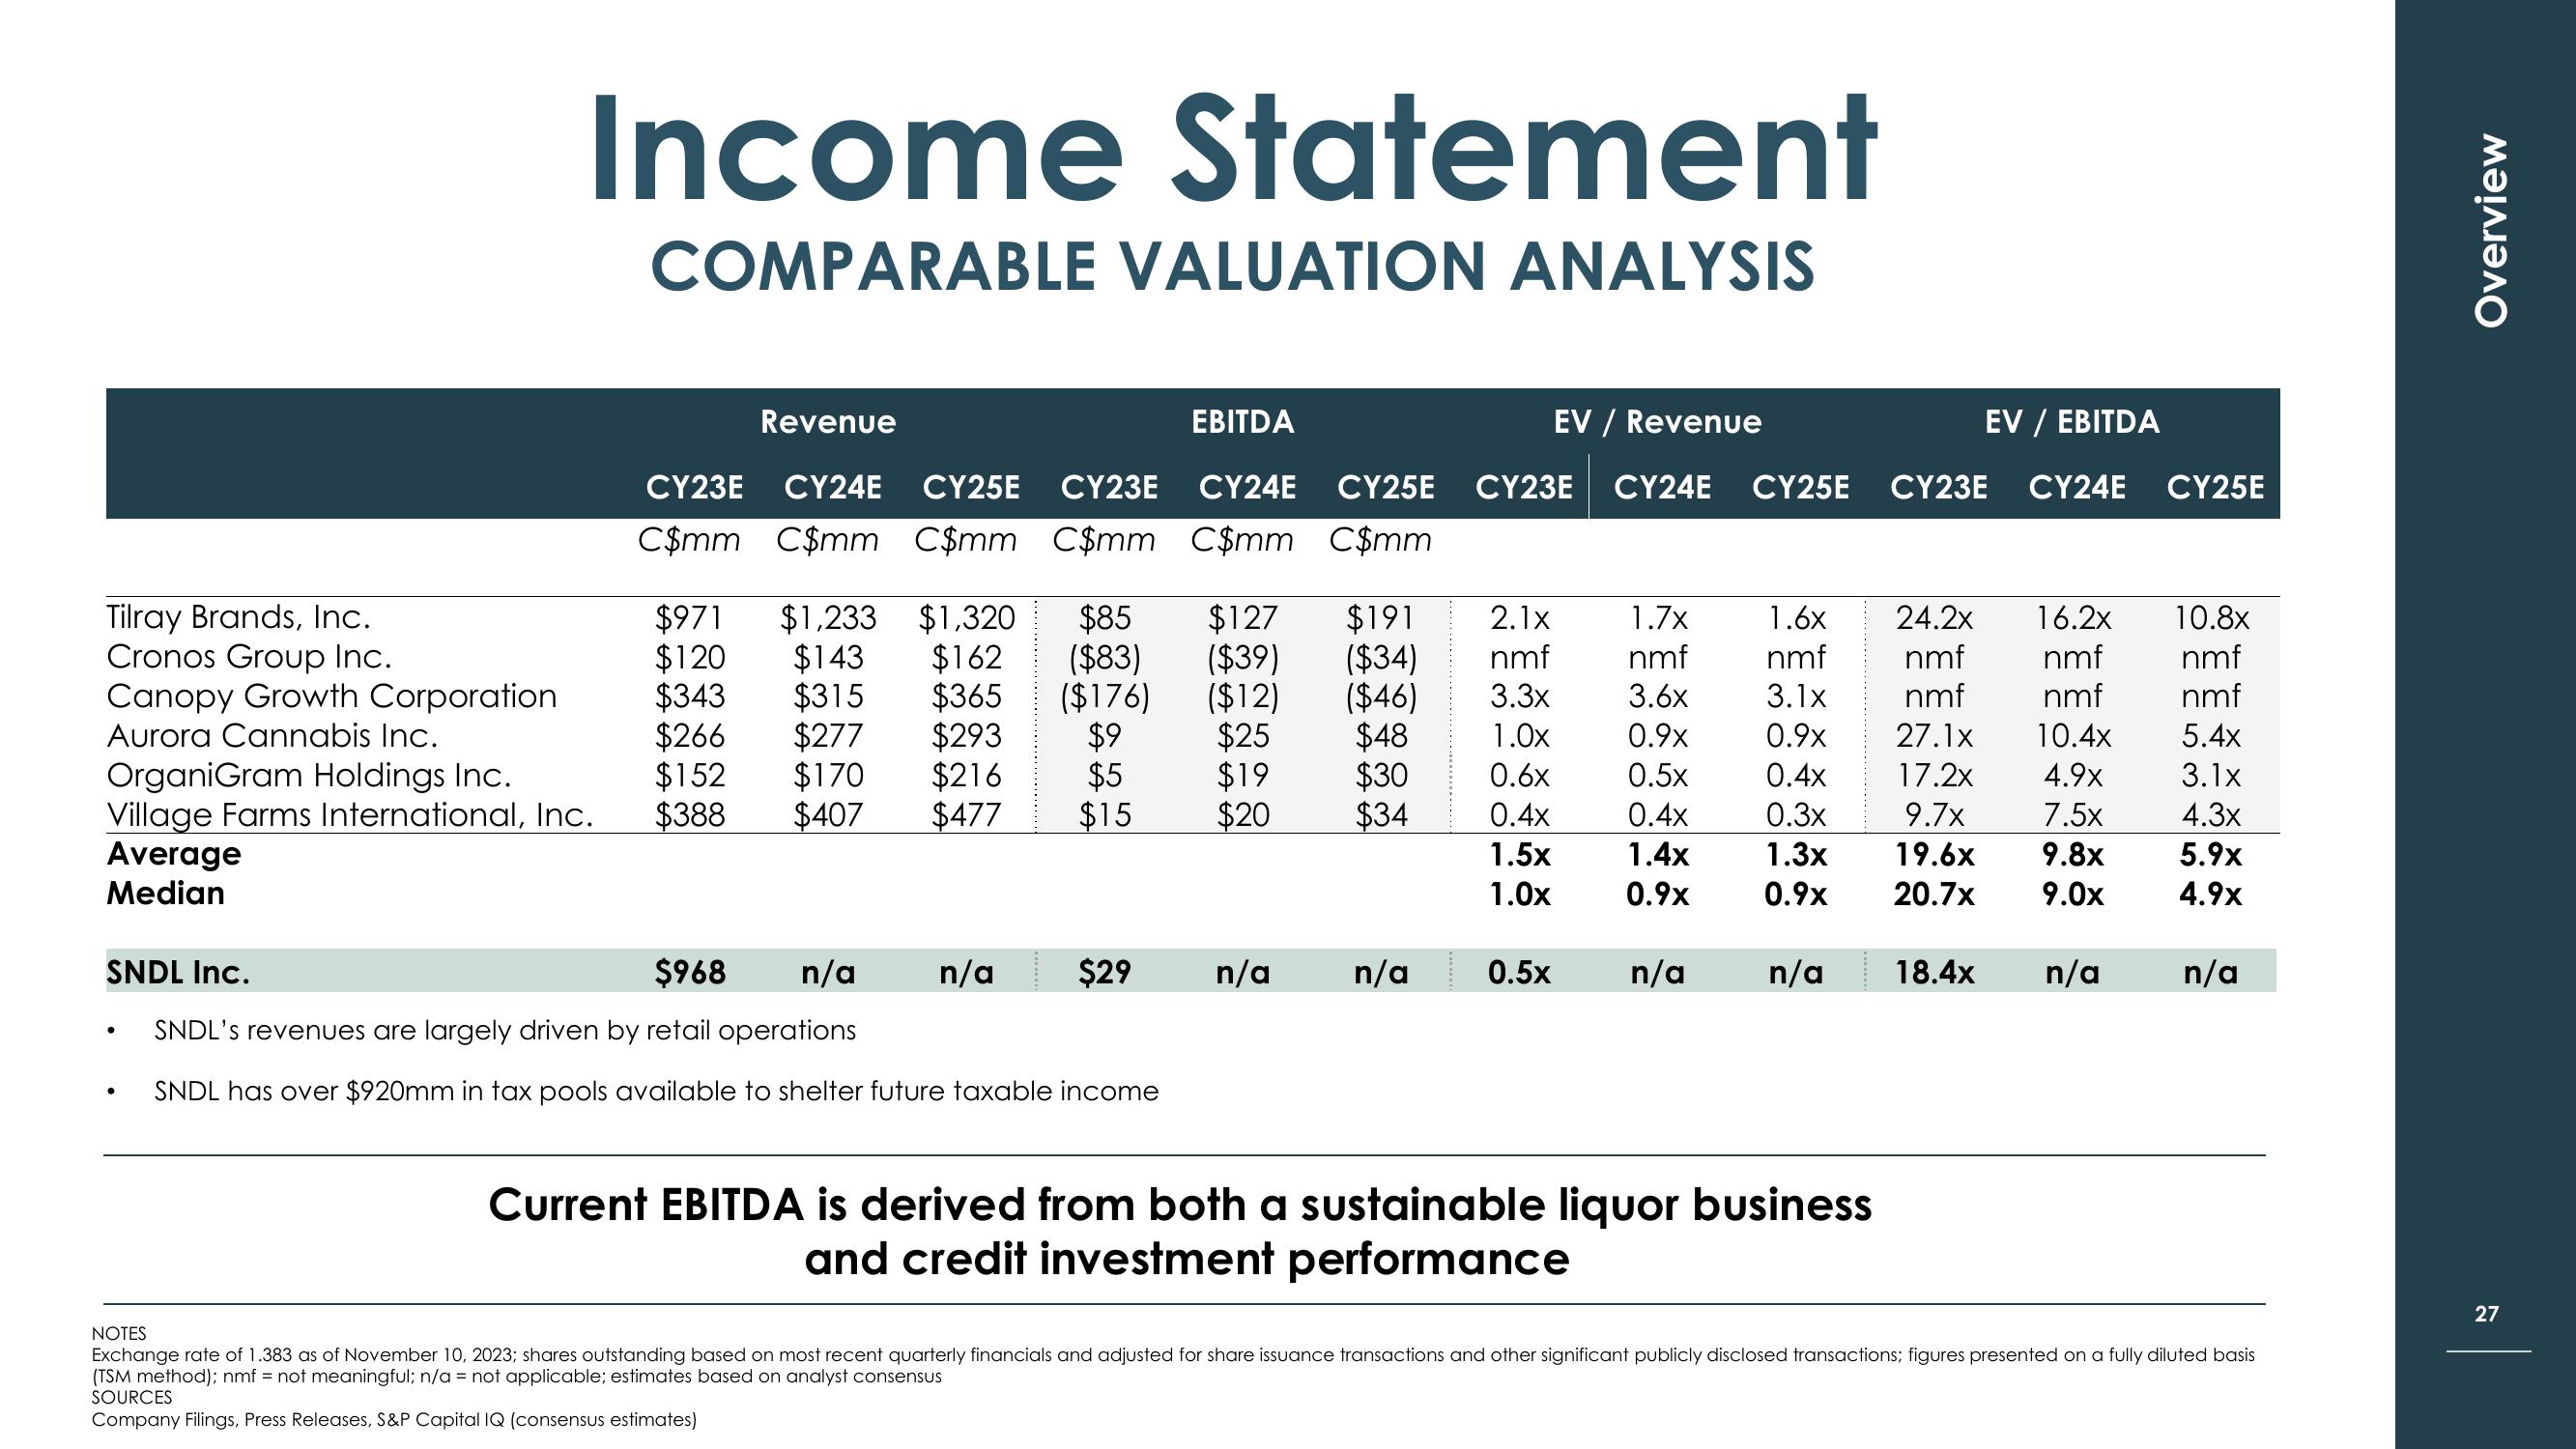
Income Statement
COMPARABLE VALUATION ANALYSIS
Tilray Brands, Inc.
Cronos Group Inc.
Canopy Growth Corporation
Aurora Cannabis Inc.
OrganiGram Holdings Inc.
Village Farms International, Inc.
Average
Median
●
Revenue
EBITDA
EV / Revenue
CY23E CY24E CY25E CY23E CY24E CY25E CY23E CY24E CY25E
C$mm C$mm C$mm C$mm C$mm_ C$mm
$971 $1,233 $1,320 $85 $127
$120
$343
$266
$152
$388 $407 $477
SNDL Inc.
$968
SNDL's revenues are largely driven by retail operations
SNDL has over $920mm in tax pools available to shelter future taxable income
$191
$143 $162 ($83) ($39) ($34)
$315 $365 ($176) ($12)
$277 $293 $9
$170 $216 $5
($46)
$25
$48
$19
$30
$15
$20
$34
n/a n/a
SOURCES
Company Filings, Press Releases, S&P Capital IQ (consensus estimates)
$29 n/a
2.1x
nmf
3.3x
1.0x
0.6x
0.4x
1.5x
1.0x
1.7x
1.6x
24.2x 16.2x
nmf
nmf
nmf
nmf
3.6x
3.1x
nmf
nmf
0.9x
0.9x 27.1x 10.4x
0.5x
0.4x
17.2x 4.9x
0.4x
0.3x
7.5x
9.7x
19.6x 9.8x
1.4x
1.3x
0.9x 0.9x
20.7x 9.0x
n/a 0.5x n/a
n/a
Current EBITDA is derived from both a sustainable liquor business
and credit investment performance
EV / EBITDA
CY23E CY24E CY25E
18.4x n/a
10.8x
nmf
nmf
5.4x
3.1x
4.3x
5.9x
4.9x
n/a
NOTES
Exchange rate of 1.383 as of November 10, 2023; shares outstanding based on most recent quarterly financials and adjusted for share issuance transactions and other significant publicly disclosed transactions; figures presented on a fully diluted basis
(TSM method); nmf = not meaningful; n/a = not applicable; estimates based on analyst consensus
Overview
27View entire presentation