J.P.Morgan 2Q23 Investor Results
JPMORGAN CHASE & CO.
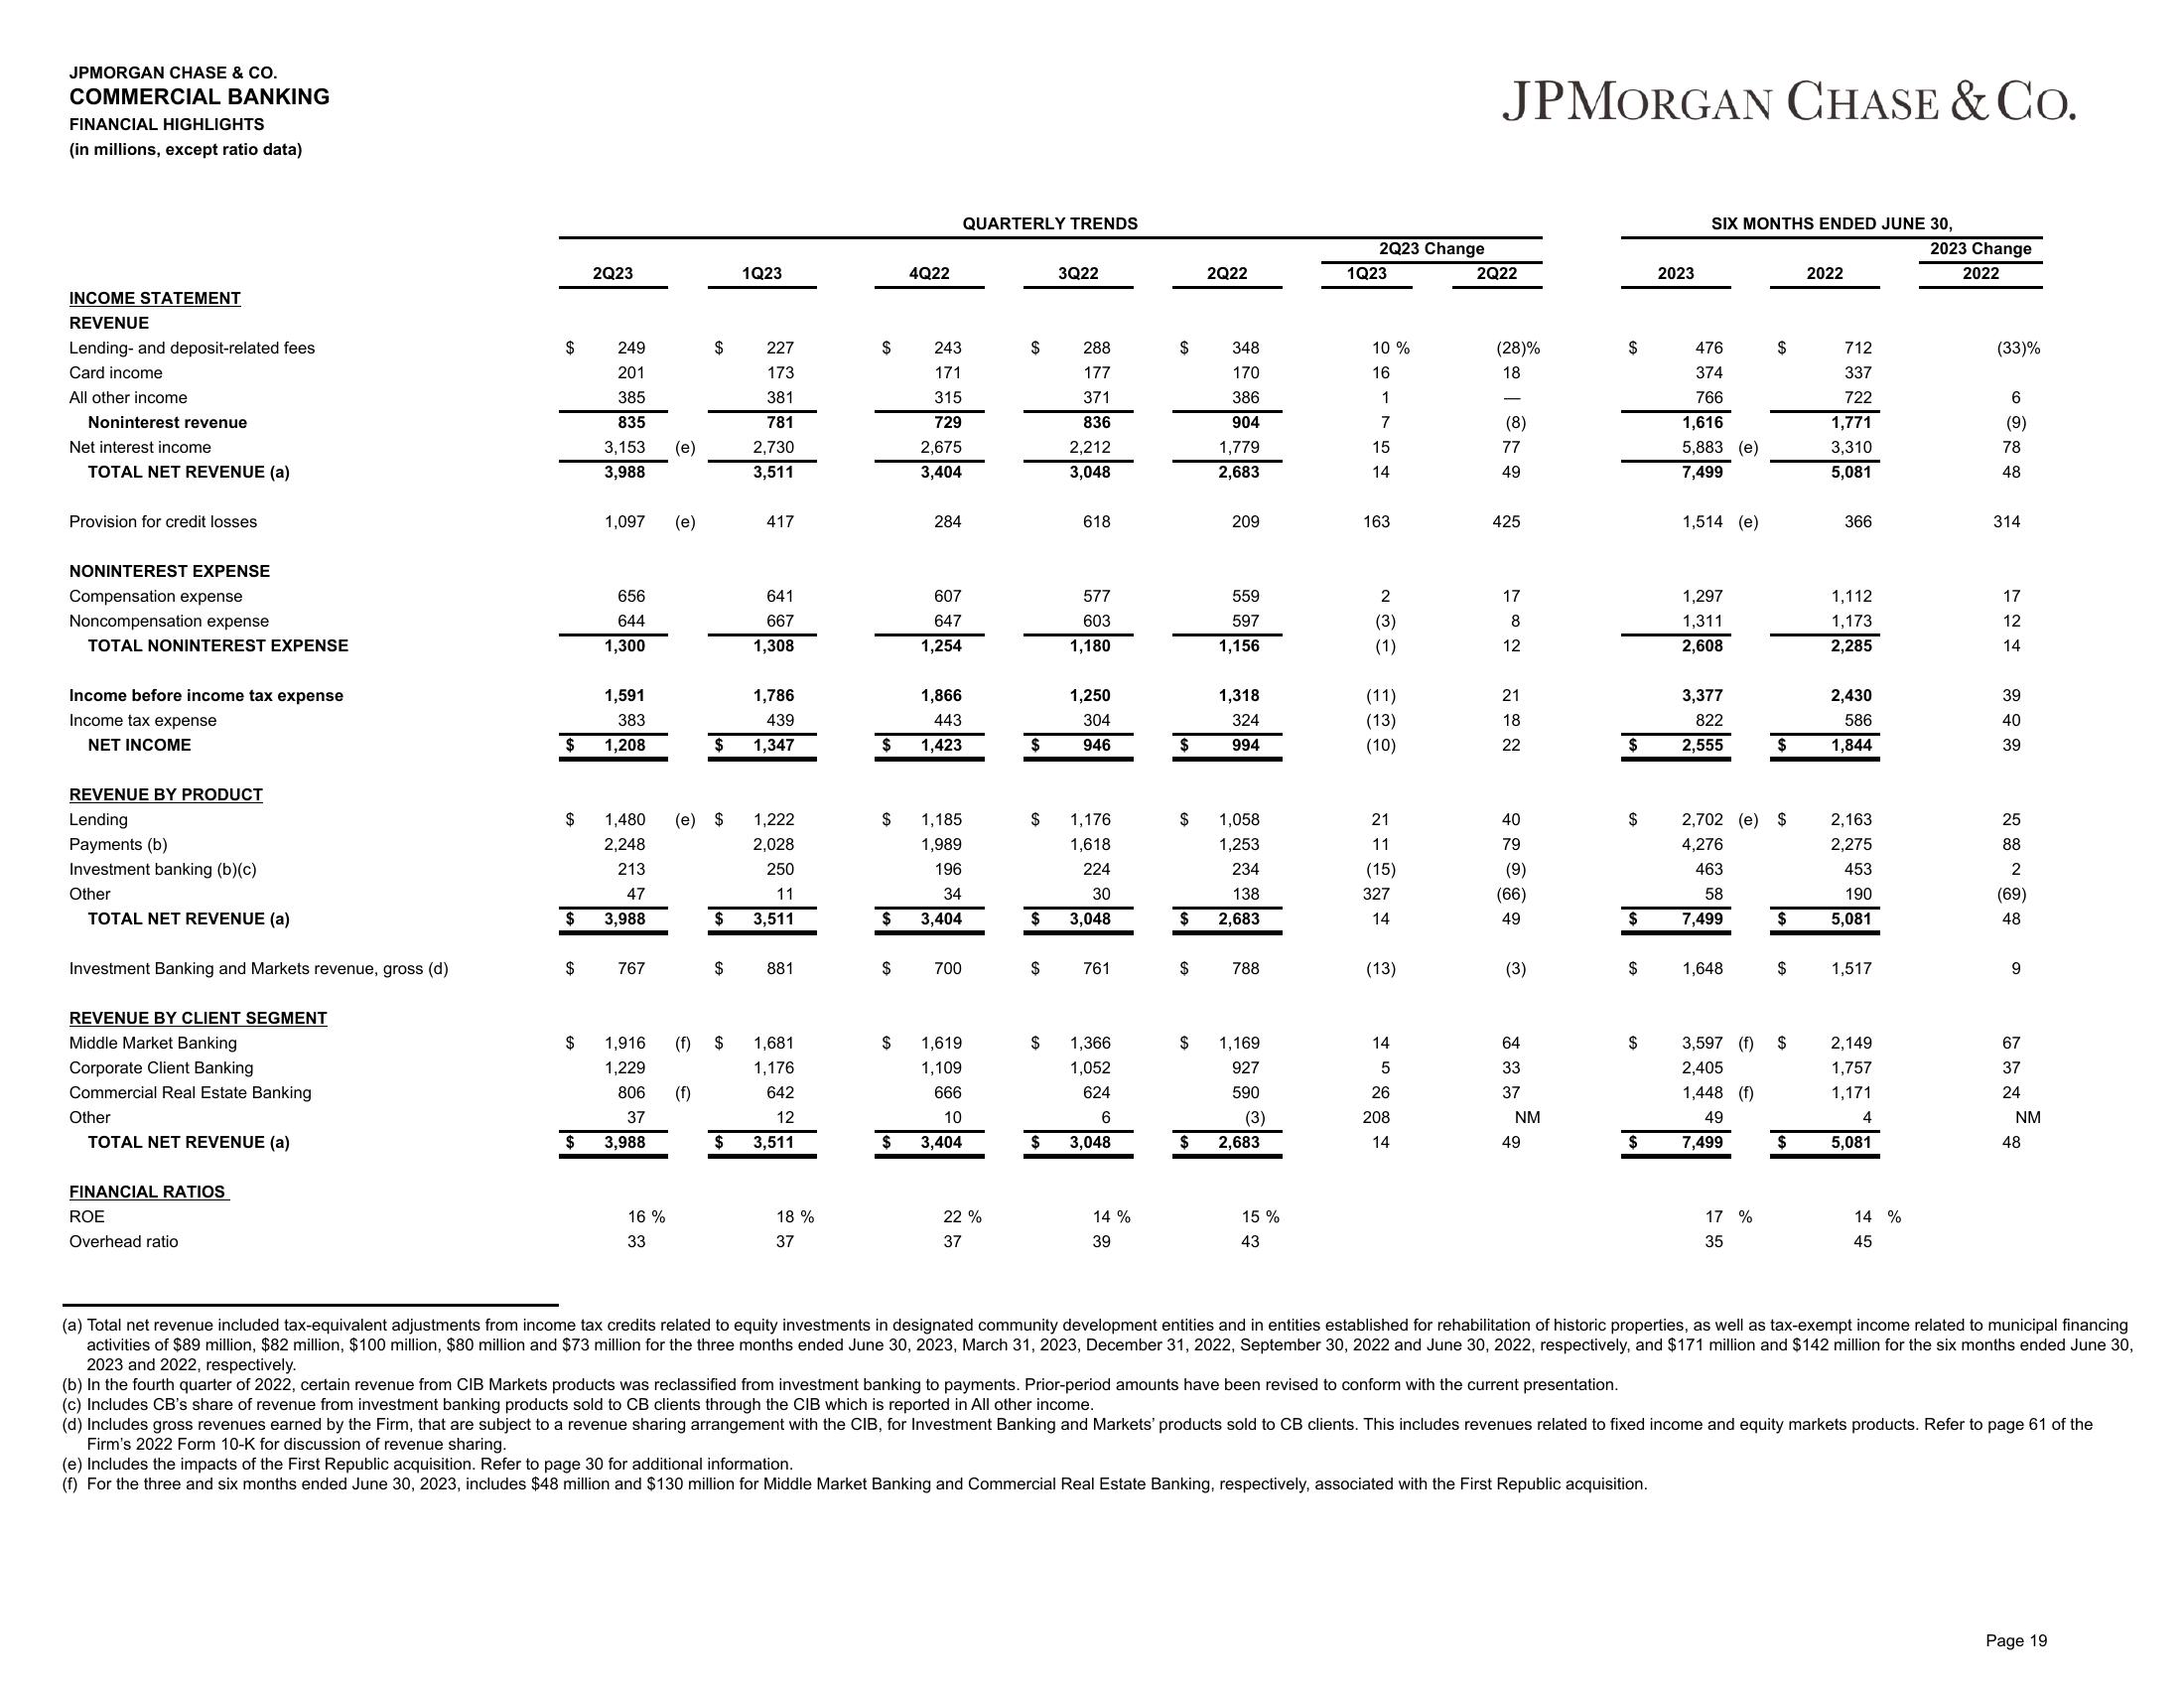
COMMERCIAL BANKING
FINANCIAL HIGHLIGHTS
(in millions, except ratio data)
INCOME STATEMENT
REVENUE
Lending- and deposit-related fees
Card income
All other income
Noninterest revenue
Net interest income
TOTAL NET REVENUE (a)
Provision for credit losses
NONINTEREST EXPENSE
Compensation expense
Noncompensation expense
TOTAL NONINTEREST EXPENSE
Income before income tax expense
Income tax expense
NET INCOME
REVENUE BY PRODUCT
Lending
Payments (b)
Investment banking (b)(c)
Other
TOTAL NET REVENUE (a)
Investment Banking and Markets revenue, gross (d)
REVENUE BY CLIENT SEGMENT
Middle Market Banking
Corporate Client Banking
Commercial Real Estate Banking
Other
TOTAL NET REVENUE (a)
FINANCIAL RATIOS
ROE
Overhead ratio
$
$
$
$
$
$
2Q23
249
201
385
835
3,153
3,988
1,097 (e)
656
644
1,300
1,591
383
1,208
(e)
767
1,480 (e) $
2,248
213
47
3,988
16%
33
$
$
(f)
$
1,916 (f) $
1,229
806
37
3,988
$
1Q23
227
173
381
781
2,730
3,511
417
641
667
1,308
1,786
439
1,347
1,222
2,028
250
11
3,511
881
1,681
1,176
642
12
$ 3,511
18 %
37
$
$
$
$
$
$
4Q22
243
171
315
729
2,675
3,404
284
607
647
1,254
QUARTERLY TRENDS
1,866
443
1,423
1,185
1,989
196
34
3,404
700
1,619
1,109
666
10
$ 3,404
22%
37
$
$
$
$
$
3Q22
$
288
177
371
836
2,212
3,048
618
577
603
1,180
1,250
304
946
1,176
1,618
224
30
3,048
761
$ 1,366
1,052
624
6
3,048
14 %
39
$
$
$
$
2Q22
$
348
170
386
904
1,779
2,683
209
559
597
1,156
1,058
1,253
234
138
$ 2,683
1,318
324
994
788
1,169
927
590
(3)
2,683
15 %
43
2Q23 Change
1Q23
10 %
16
1
7
15
14
163
2
(3)
(1)
(11)
(13)
(10)
21
11
(15)
327
14
(13)
14
5
26
208
14
JPMORGAN CHASE & Co.
2Q22
(28)%
18
- (8) 77 49
425
17
8
12
21
18
22
40
79
(9)
(66)
49
(3)
64
33
37
NM
49
$
$
$
$
$
2023
SIX MONTHS ENDED JUNE 30,
(e) Includes the impacts of the First Republic acquisition. Refer to page 30 for additional information.
(f) For the three and six months ended June 30, 2023, includes $48 million and $130 million for Middle Market Banking and Commercial Real Estate Banking, respectively, associated with the First Republic acquisition.
476
374
766
1,616
5,883 (e)
7,499
1,514 (e)
1,297
1,311
2,608
2,702 (e) $
4,276
463
58
$ 7,499
3,377
822
2,555
1,648
$
$
17%
35
$
$
3,597 (f) $
2,405
1,448 (f)
49
7,499
$
2022
712
337
722
1,771
3,310
5,081
366
1,112
1,173
2,285
2,430
586
1,844
2,163
2,275
453
190
5,081
1,517
2,149
1,757
1,171
4
5,081
14 %
45
2023 Change
2022
(33)%
6
(9)
78
48
314
17
12
14
39
40
39
25
88
2
(69)
48
9
67
37
24
NM
48
(a) Total net revenue included tax-equivalent adjustments from income tax credits related to equity investments in designated community development entities and in entities established for rehabilitation of historic properties, as well as tax-exempt income related to municipal financing
activities of $89 million, $82 million, $100 million, $80 million and $73 million for the three months ended June 30, 2023, March 31, 2023, December 31, 2022, September 30, 2022 and June 30, 2022, respectively, and $171 million and $142 million for the six months ended June 30,
2023 and 2022, respectively.
(b) In the fourth quarter of 2022, certain revenue from CIB Markets products was reclassified from investment banking to payments. Prior-period amounts have been revised to conform with the current presentation.
(c) Includes CB's share of revenue from investment banking products sold to CB clients through the CIB which is reported in All other income.
(d) Includes gross revenues earned by the Firm, that are subject to a revenue sharing arrangement with the CIB, for Investment Banking and Markets' products sold to CB clients. This includes revenues related to fixed income and equity markets products. Refer to page 61 of the
Firm's 2022 Form 10-K for discussion of revenue sharing.
Page 19View entire presentation