Sotheby's Investor Presentation Deck
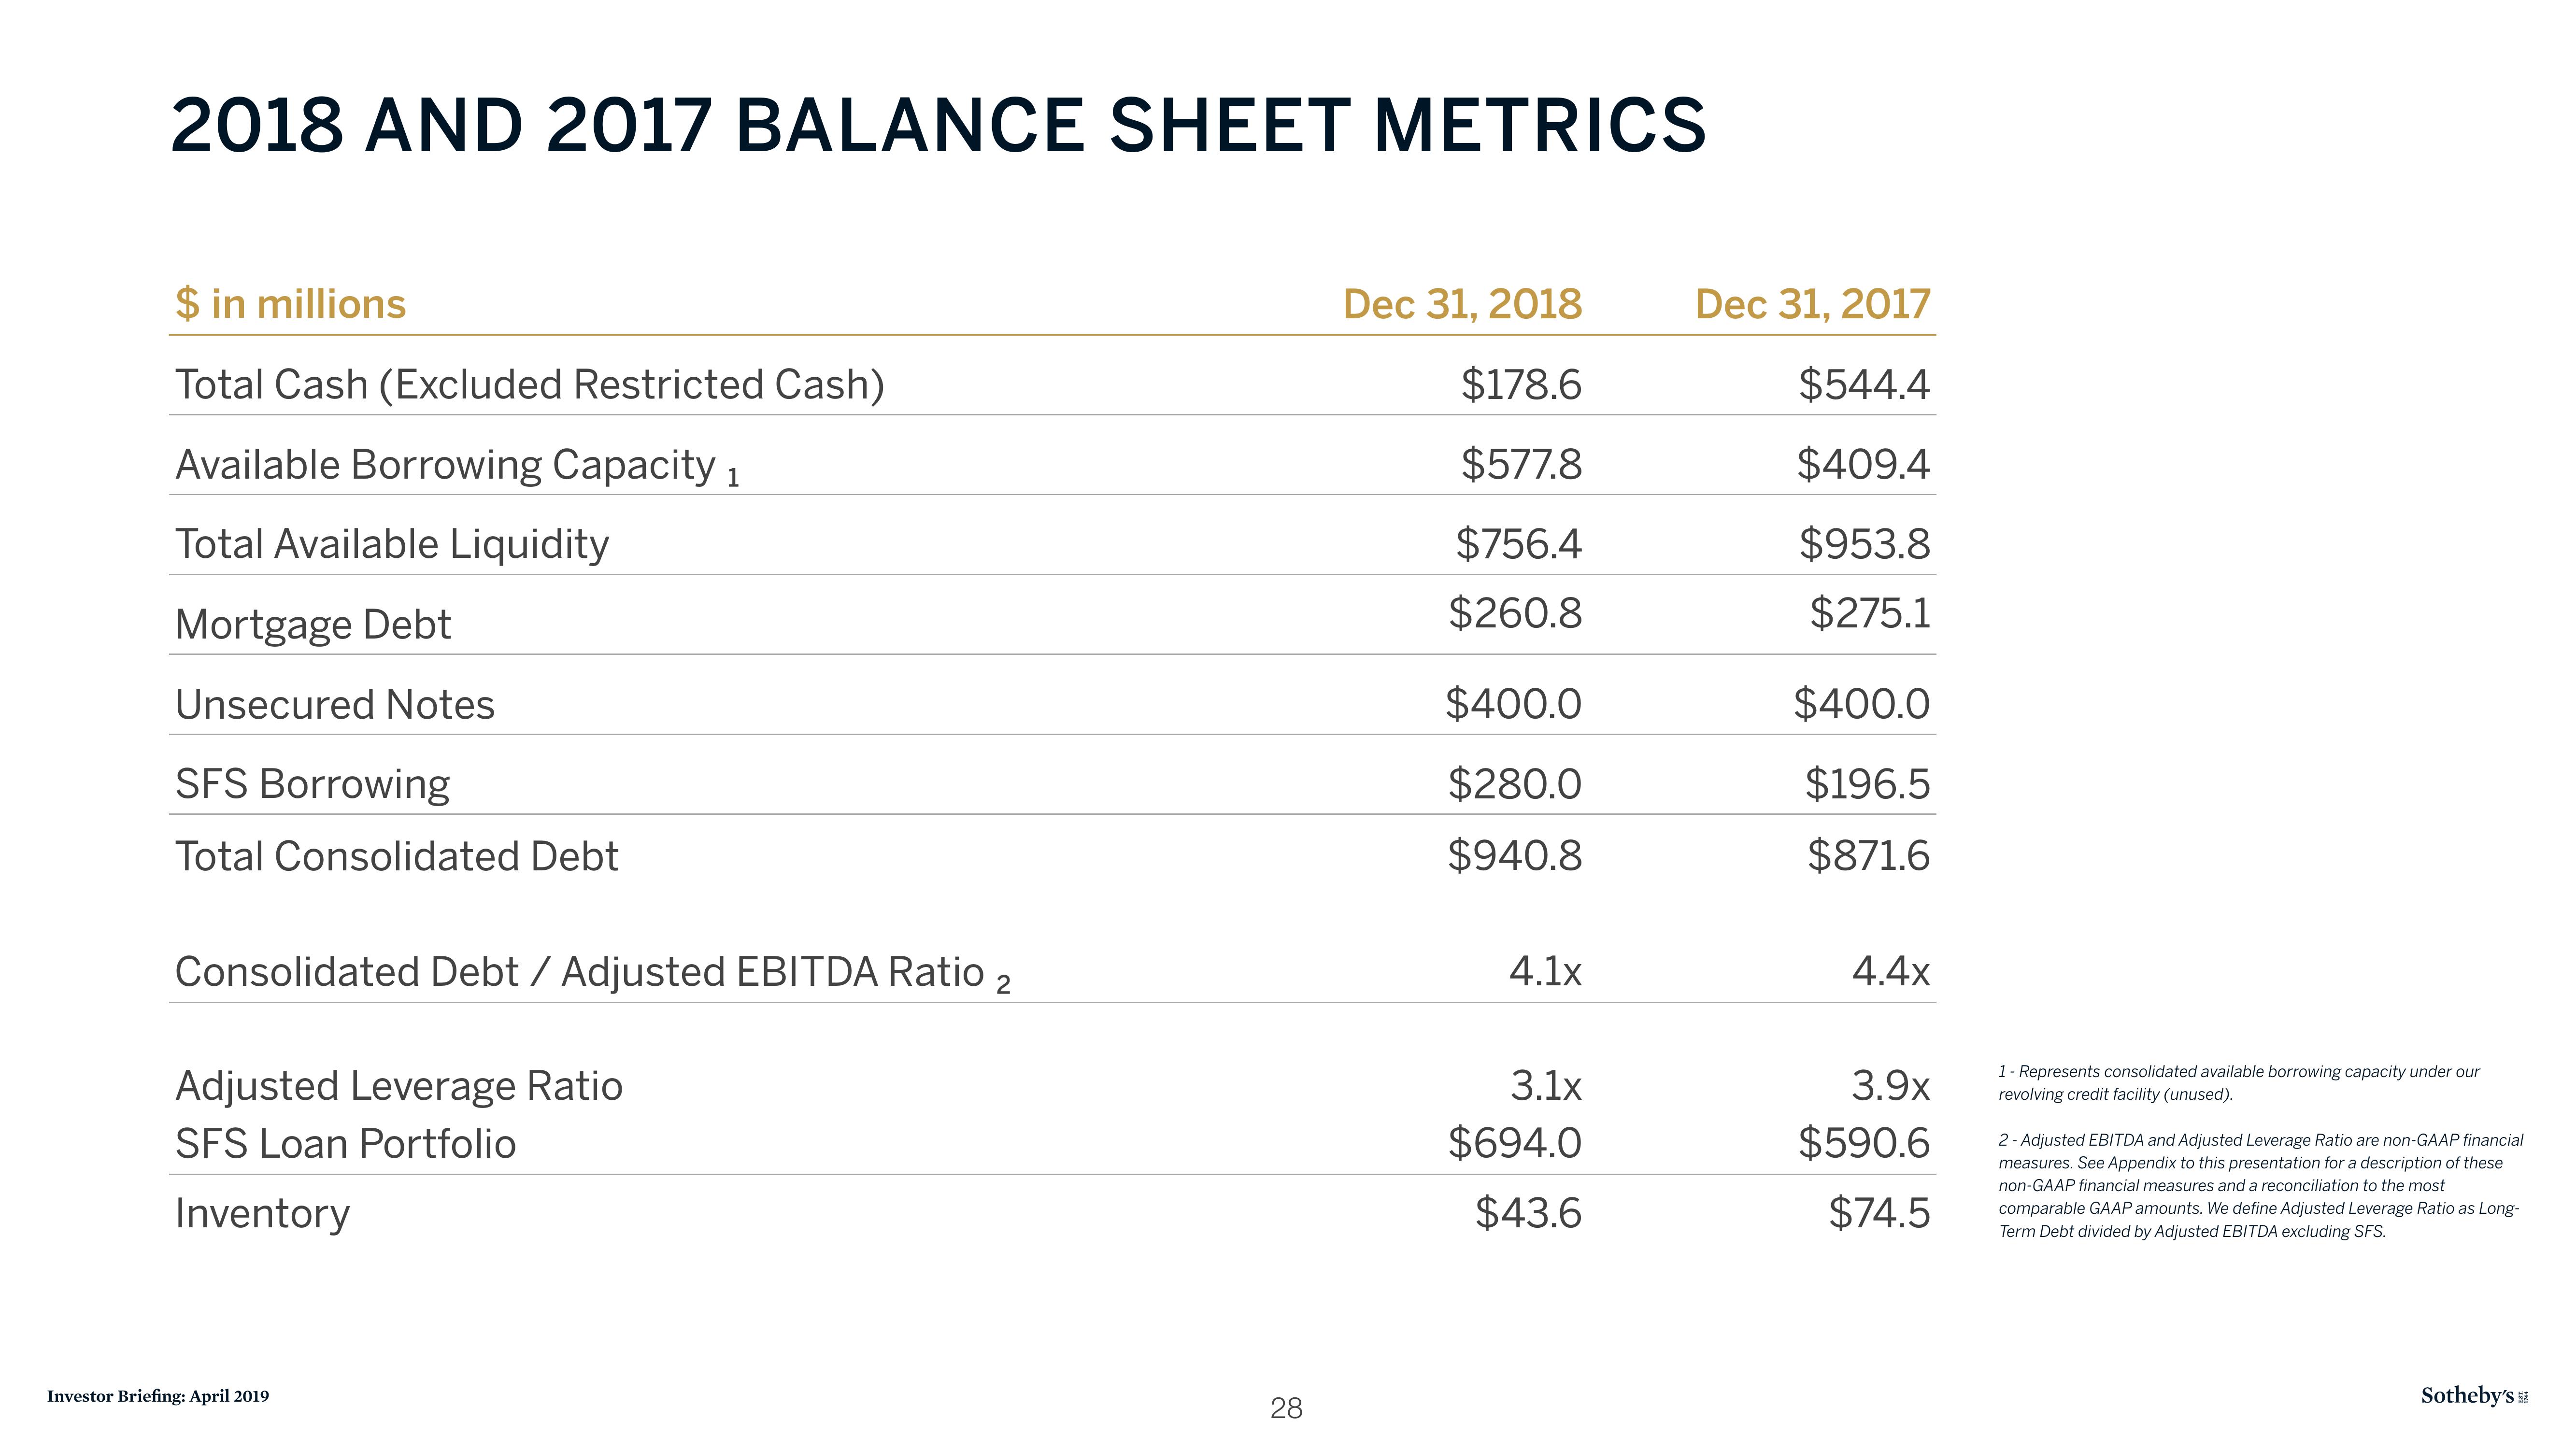
2018 AND 2017 BALANCE SHEET METRICS
$ in millions
Total Cash (Excluded Restricted Cash)
Available Borrowing Capacity 1
Total Available Liquidity
Mortgage Debt
Unsecured Notes
SFS Borrowing
Total Consolidated Debt
Consolidated Debt / Adjusted EBITDA Ratio
Adjusted Leverage Ratio
SFS Loan Portfolio
Inventory
Investor Briefing: April 2019
2
28
Dec 31, 2018
$178.6
$577.8
$756.4
$260.8
$400.0
$280.0
$940.8
4.1x
3.1x
$694.0
$43.6
Dec 31, 2017
$544.4
$409.4
$953.8
$275.1
$400.0
$196.5
$871.6
4.4x
3.9x
$590.6
$74.5
1- Represents consolidated available borrowing capacity under our
revolving credit facility (unused).
2-Adjusted EBITDA and Adjusted Leverage Ratio are non-GAAP financial
measures. See Appendix to this presentation for a description of these
non-GAAP financial measures and a reconciliation to the most
comparable GAAP amounts. We define Adjusted Leverage Ratio as Long-
Term Debt divided by Adjusted EBITDA excluding SFS.
Sotheby'sView entire presentation