MoneyLion SPAC Presentation Deck
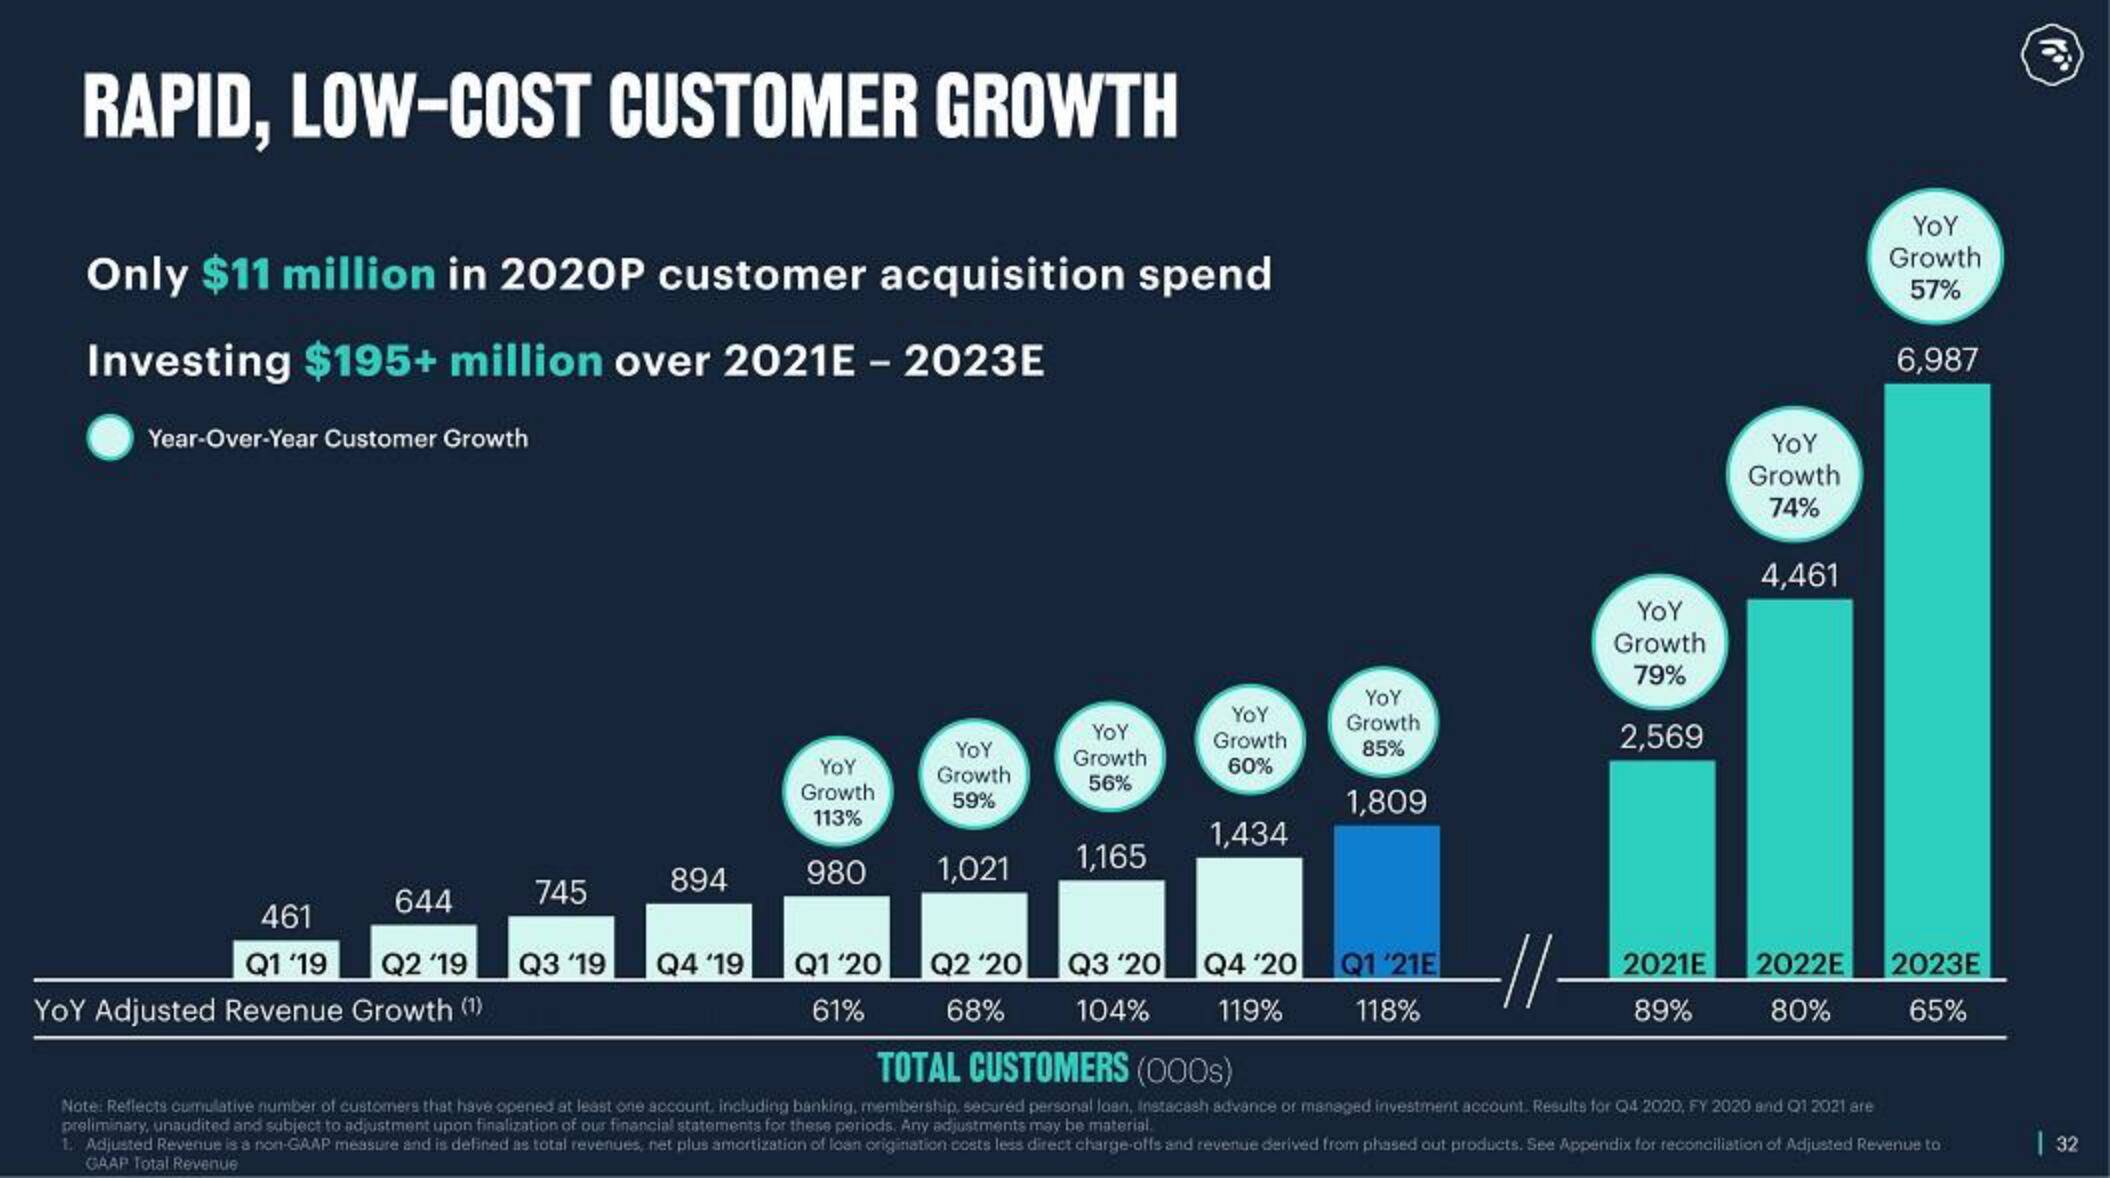
RAPID, LOW-COST CUSTOMER GROWTH
Only $11 million in 2020P customer acquisition spend
Investing $195+ million over 2021E - 2023E
Year-Over-Year Customer Growth
644
461
Q1 '19 Q2 '19
YOY Adjusted Revenue Growth (1)
745
Q3 '19
894
Q4 '19
YOY
Growth
113%
980
Q1'20
61%
Yoy
Growth
59%
1,021
Q2 '20
68%
YoY
Growth
56%
1,165
Q3 '20
104%
YoY
Growth
60%
1,434
Q4 '20
119%
YOY
Growth
85%
1,809
Q1 '21E
118%
-//
YoY
Growth
79%
2,569
YoY
Growth
74%
4,461
YoY
Growth
57%
6,987
2021E 2022E 2023E
65%
89%
80%
TOTAL CUSTOMERS (000s)
Note: Reflects cumulative number of customers that have opened at least one account, including banking, membership, secured personal loan, Instacash advance or managed investment account. Results for Q4 2020, FY 2020 and Q1 2021 are
preliminary, unaudited and subject to adjustment upon finalization of our financial statements for these periods. Any adjustments may be material.
1. Adjusted Revenue is a non-GAAP measure and is defined as total revenues, net plus amortization of loan origination costs less direct charge-offs and revenue derived from phased out products. See Appendix for reconciliation of Adjusted Revenue to
GAAP Total Revenue
(10⁰)
| 32View entire presentation