Nauticus SPAC Presentation Deck
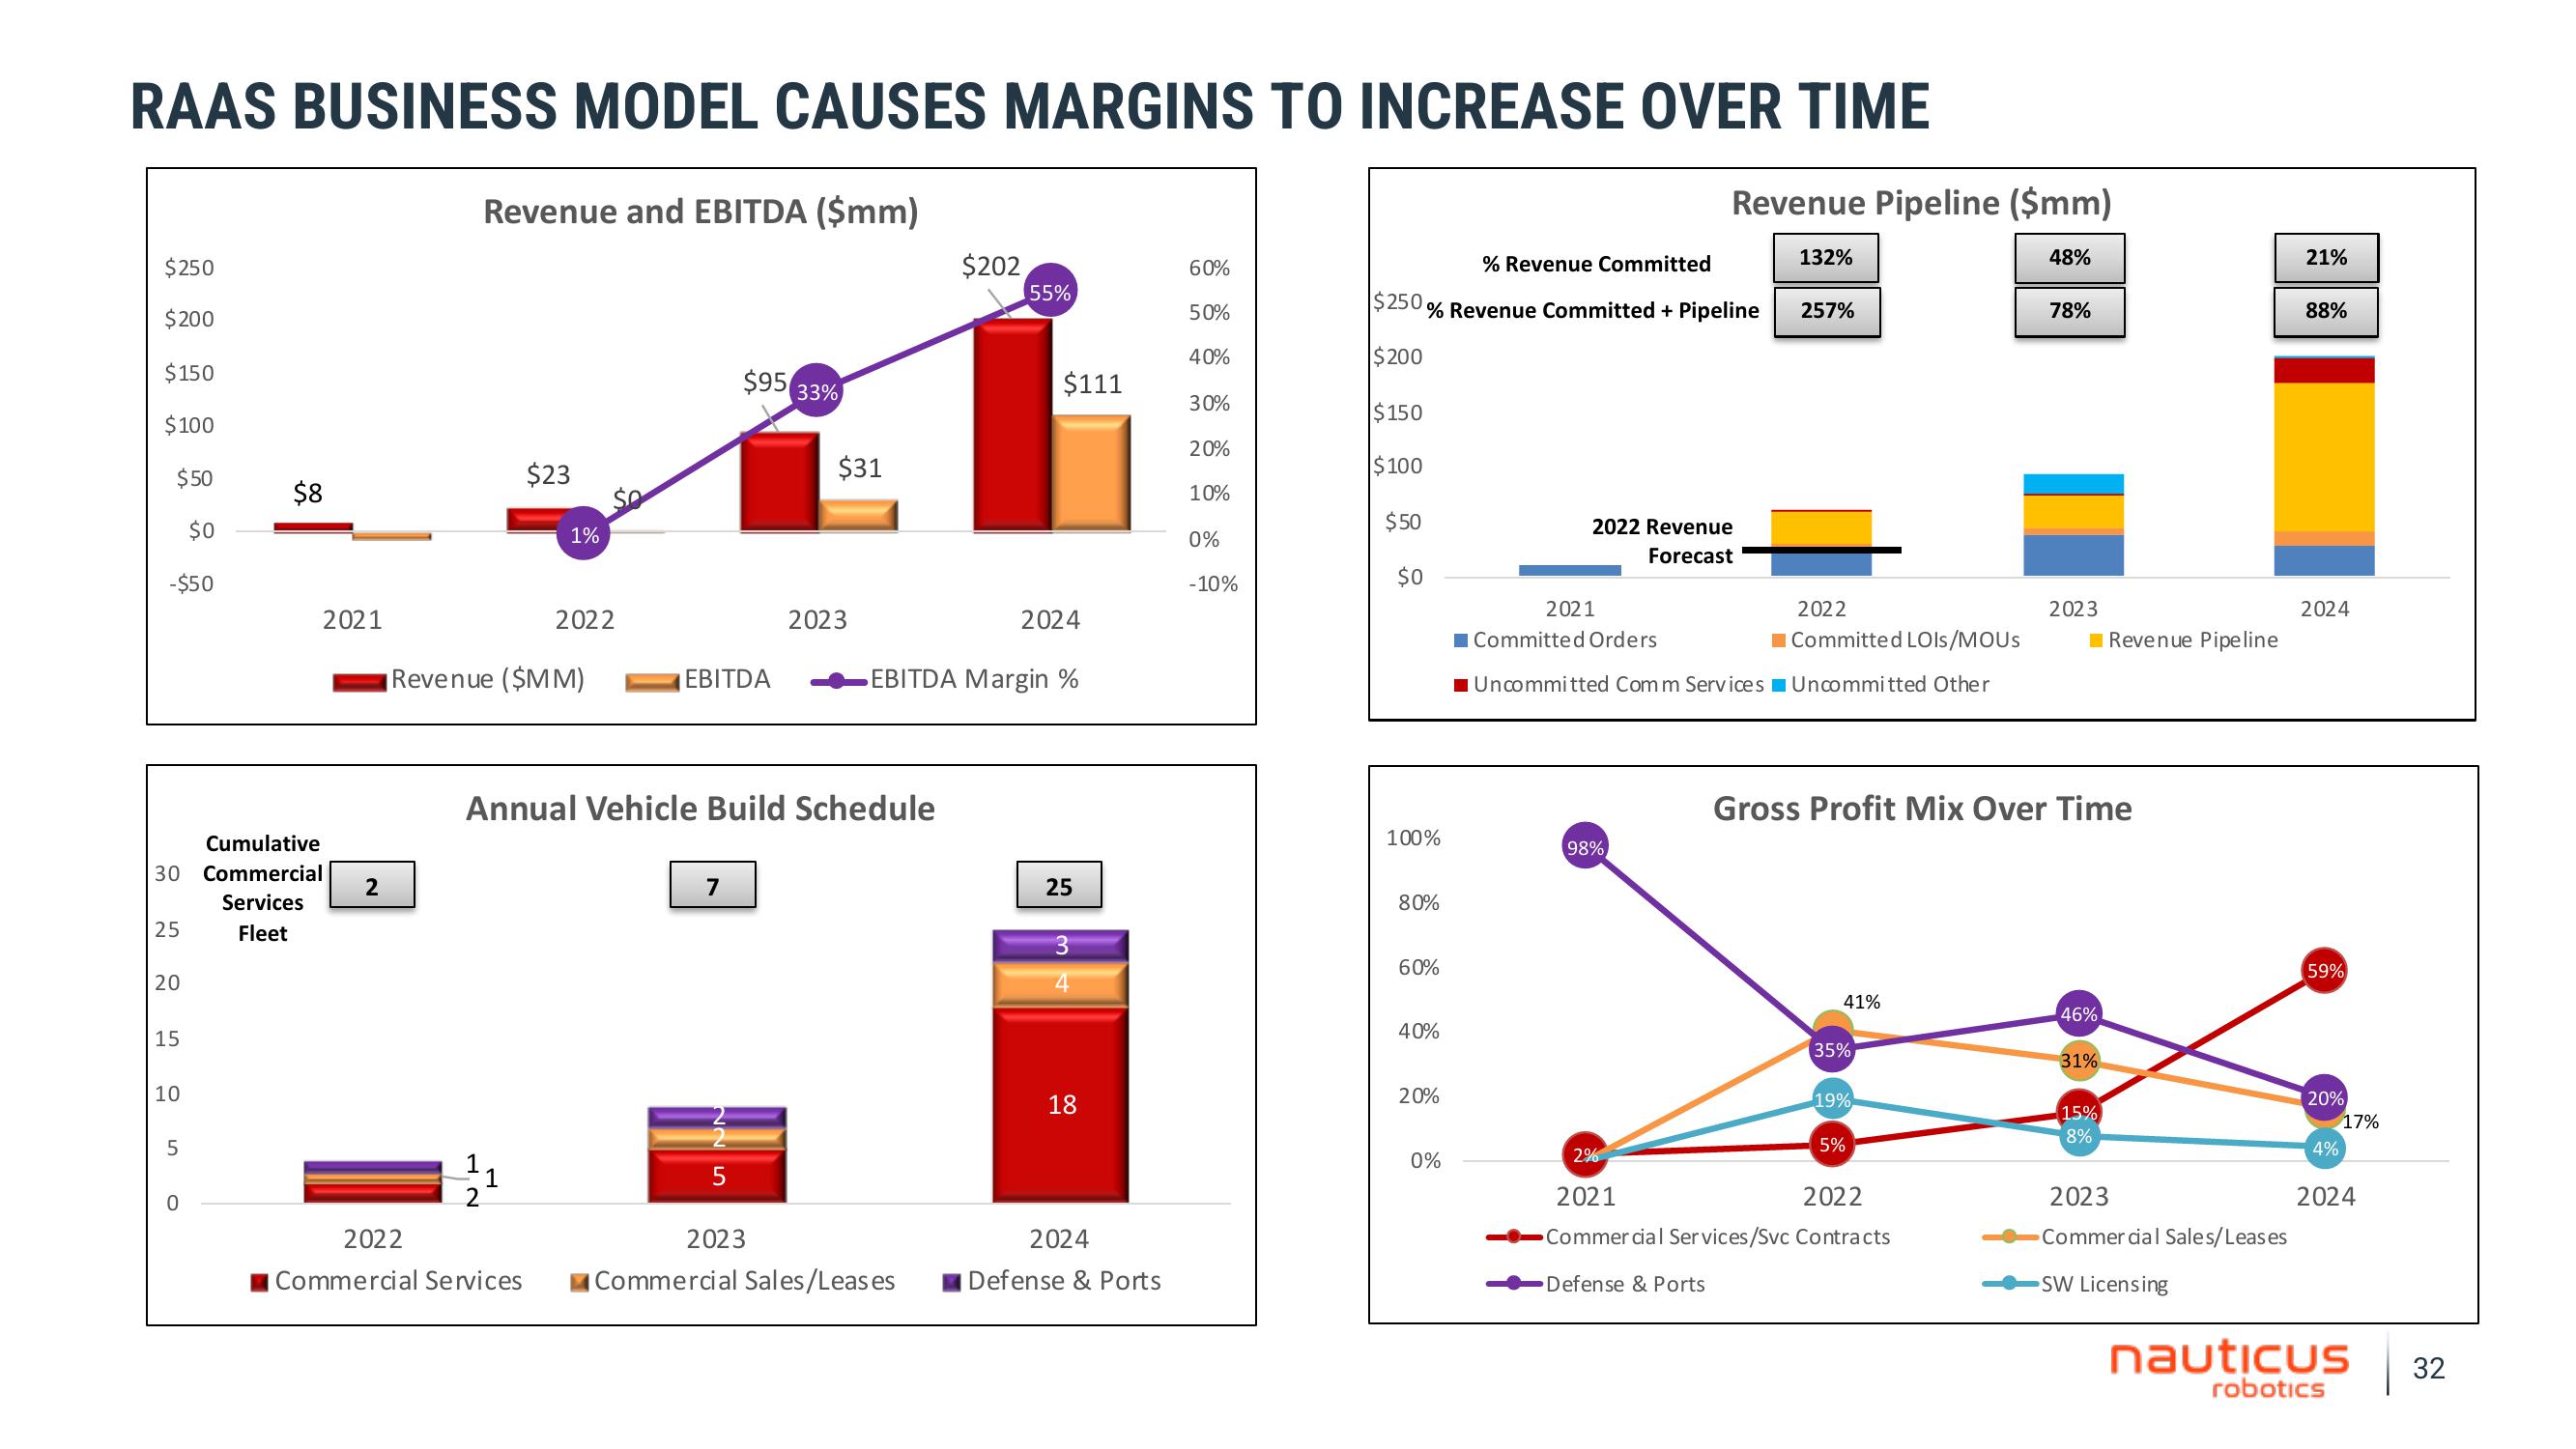
RAAS BUSINESS MODEL CAUSES MARGINS TO INCREASE OVER TIME
$250
$200
$150
$100
$50
$0
-$50
30
25
20
15
10
5
0
$8
2021
Cumulative
Commercial
Services
Fleet
2
Revenue and EBITDA ($mm)
1
2
Revenue ($MM)
$23
1
1%
2022
Commercial Services
SO
2022
EBITDA
$95
Annual Vehicle Build Schedule
7
5
33%
2023
$31
2023
$202
Commercial Sales/Leases
55%
$111
EBITDA Margin %
2024
25
34
18
2024
Defense & Ports
60%
50%
40%
30%
20%
10%
0%
-10%
% Revenue Committed
$250% Revenue Committed + Pipeline
$200
$150
$100
$50
$0
100%
80%
60%
40%
20%
0%
Revenue Pipeline ($mm)
2022 Revenue
Forecast
2021
98%
132%
2022
Committed LOIS/MOUS
Committed Orders
Uncommitted Comm Services Uncommitted Other
257%
41%
35%
19%
Gross Profit Mix Over Time
5%
48%
2%
2021
2022
Commercial Services/Svc Contracts
Defense & Ports
78%
2023
46%
31%
Revenue Pipeline
15%
8%
2023
Commercial Sales/Leases
SW Licensing
21%
88%
2024
59%
20%
4%
17%
2024
nauticus
robotics
32View entire presentation