Bridge Investment Group Results Presentation Deck
Appendix
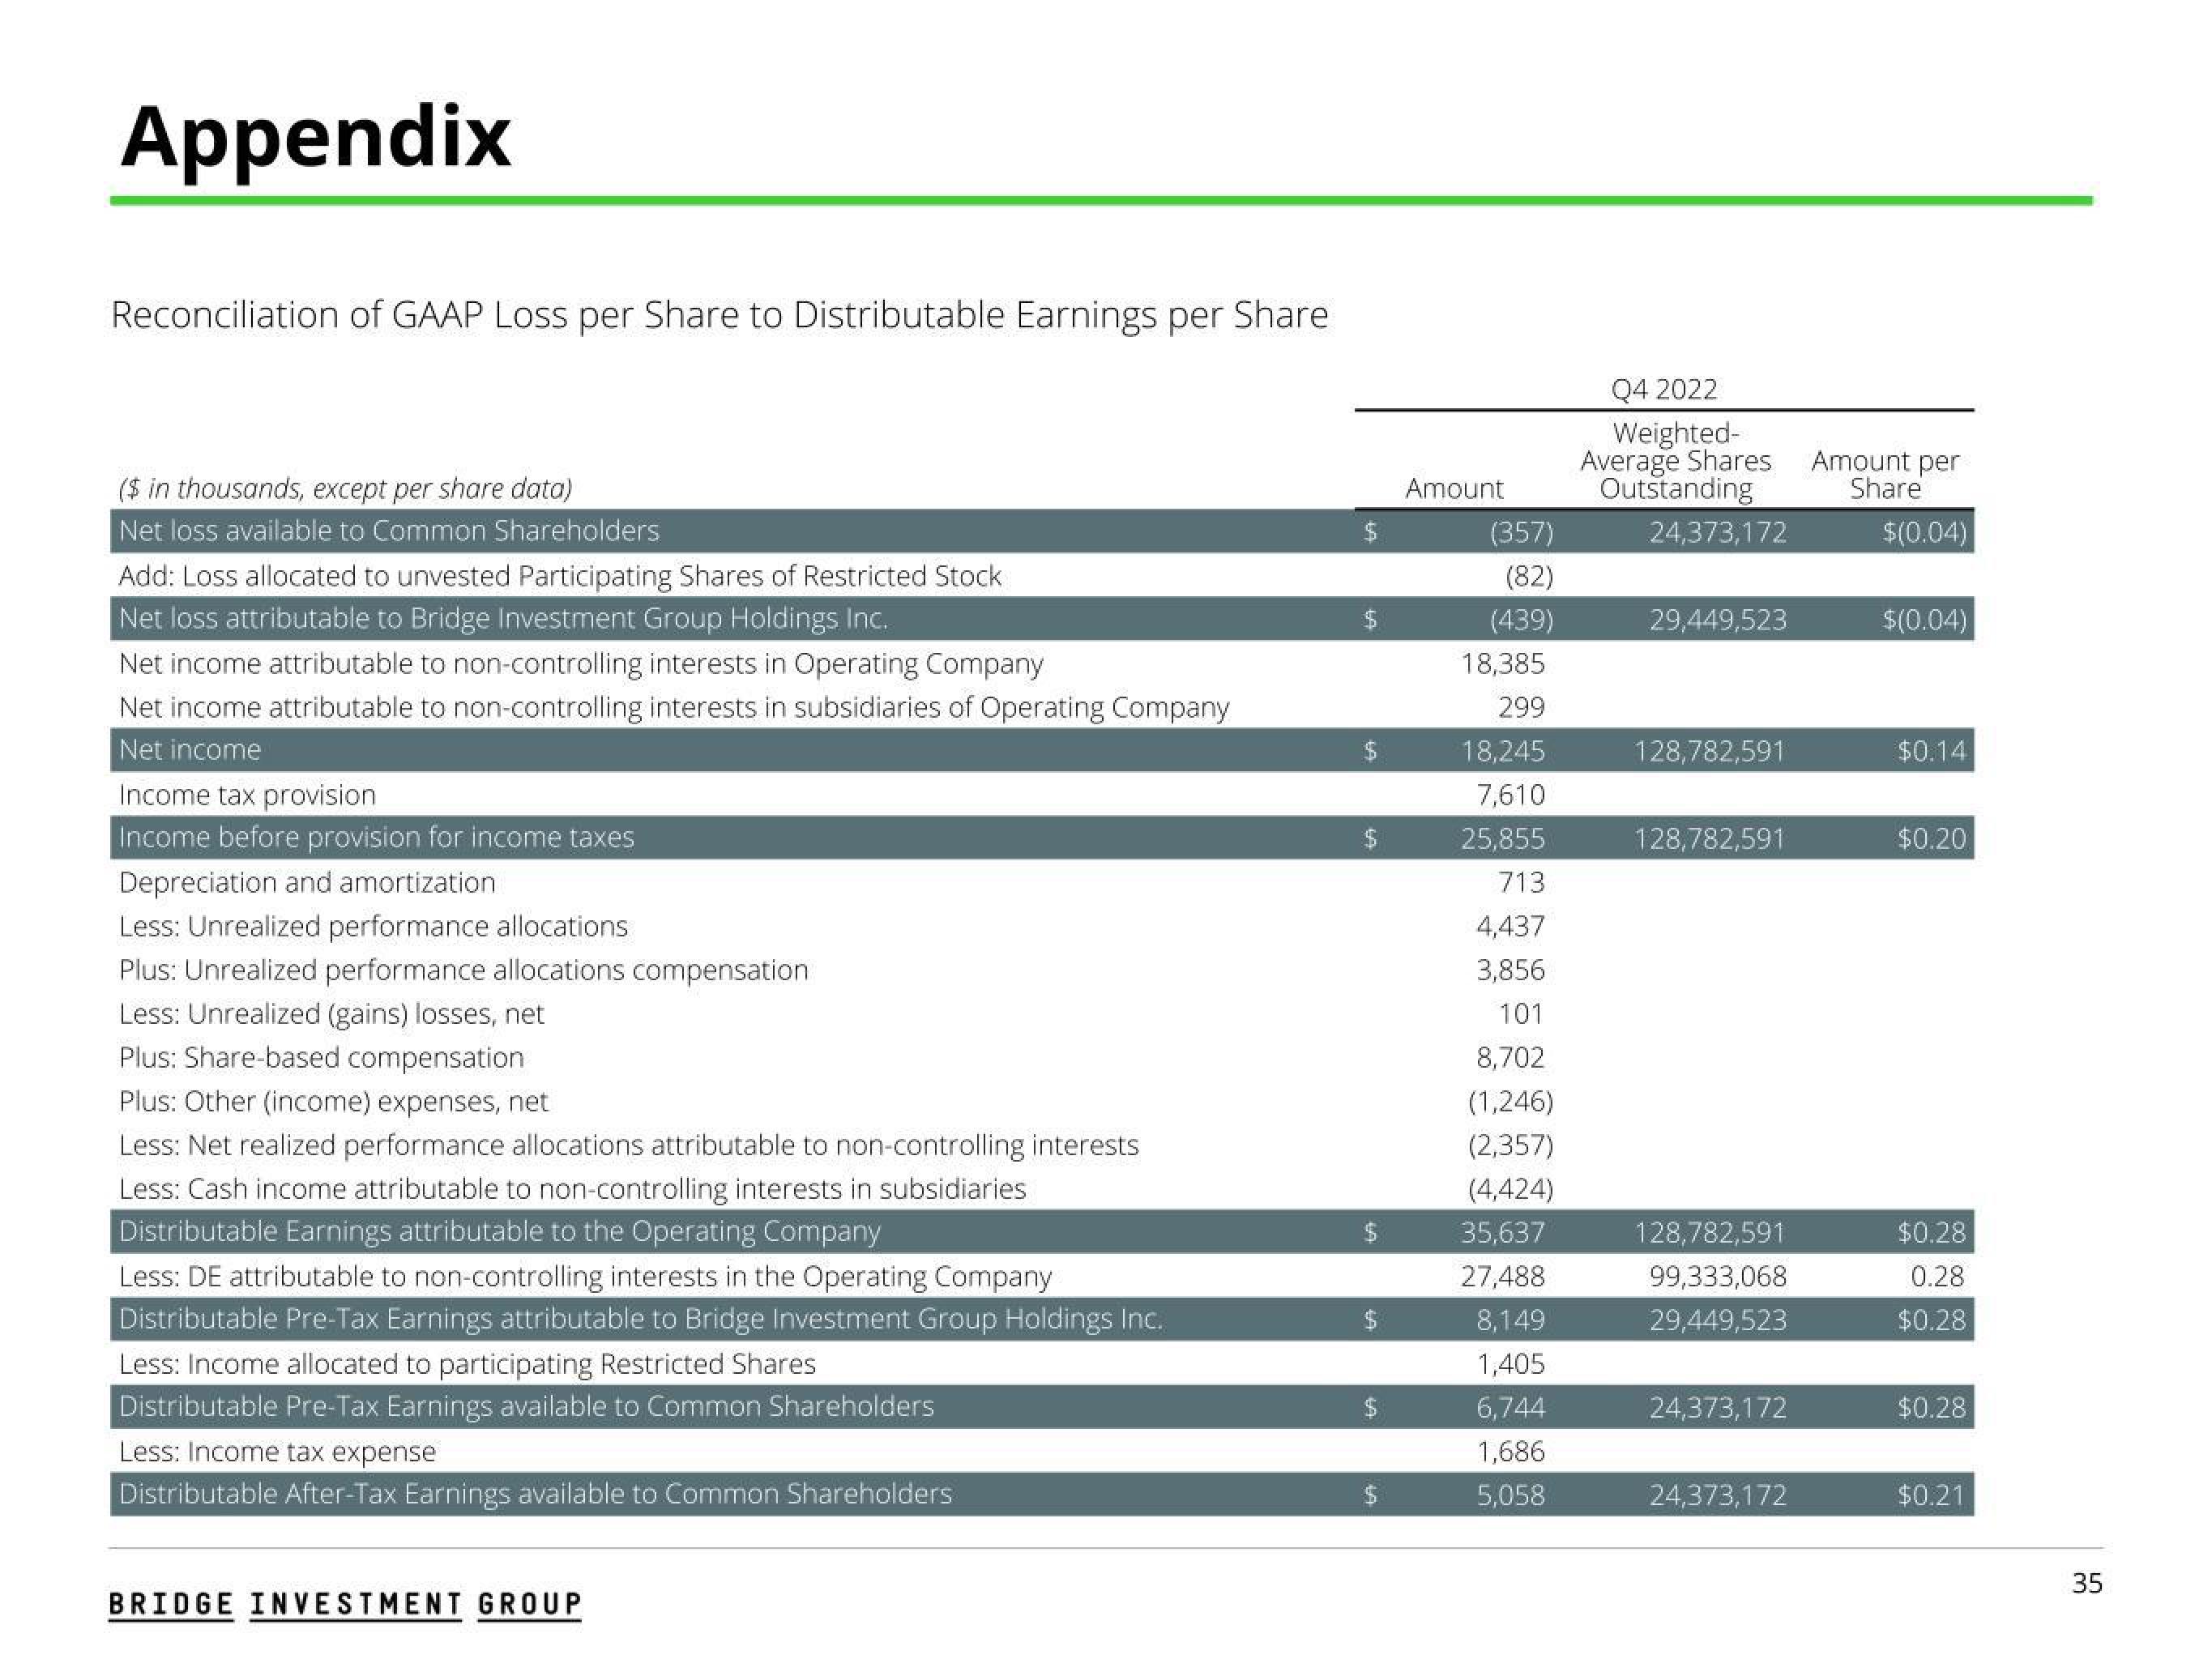
Reconciliation of GAAP Loss per Share to Distributable Earnings per Share
($ in thousands, except per share data)
Net loss available to Common Shareholders
Add: Loss allocated to unvested Participating Shares of Restricted Stock
Net loss attributable to Bridge Investment Group Holdings Inc.
Net income attributable to non-controlling interests in Operating Company
Net income attributable to non-controlling interests in subsidiaries of Operating Company
Net income
Income tax provision
Income before provision for income taxes
Depreciation and amortization
Less: Unrealized performance allocations
Plus: Unrealized performance allocations compensation
Less: Unrealized (gains) losses, net
Plus: Share-based compensation
Plus: Other (income) expenses, net
Less: Net realized performance allocations attributable to non-controlling interests
Less: Cash income attributable to non-controlling interests in subsidiaries
Distributable Earnings attributable to the Operating Company
Less: DE attributable to non-controlling interests in the Operating Company
Distributable Pre-Tax Earnings attributable to Bridge Investment Group Holdings Inc.
Less: Income allocated to participating Restricted Shares
Distributable Pre-Tax Earnings available to Common Shareholders
Less: Income tax expense
Distributable After-Tax Earnings available to Common Shareholders
BRIDGE INVESTMENT GROUP
$
$
LA
$
$
$
$
$
$
Amount
(357)
(82)
(439)
18,385
299
18,245
7,610
25,855
713
4,437
3,856
101
8,702
(1,246)
(2,357)
(4,424)
35,637
27,488
8,149
1,405
6,744
1,686
5,058
Q4 2022
Weighted-
Average Shares
Outstanding
24,373,172
29,449,523
128,782,591
128,782,591
128,782,591
99,333,068
29,449,523
24,373,172
24,373,172
Amount per
Share
$(0.04)
$(0.04)
$0.14
$0.20
$0.28
0.28
$0.28
$0.28
$0.21
35View entire presentation