Endeavour Mining Investor Presentation Deck
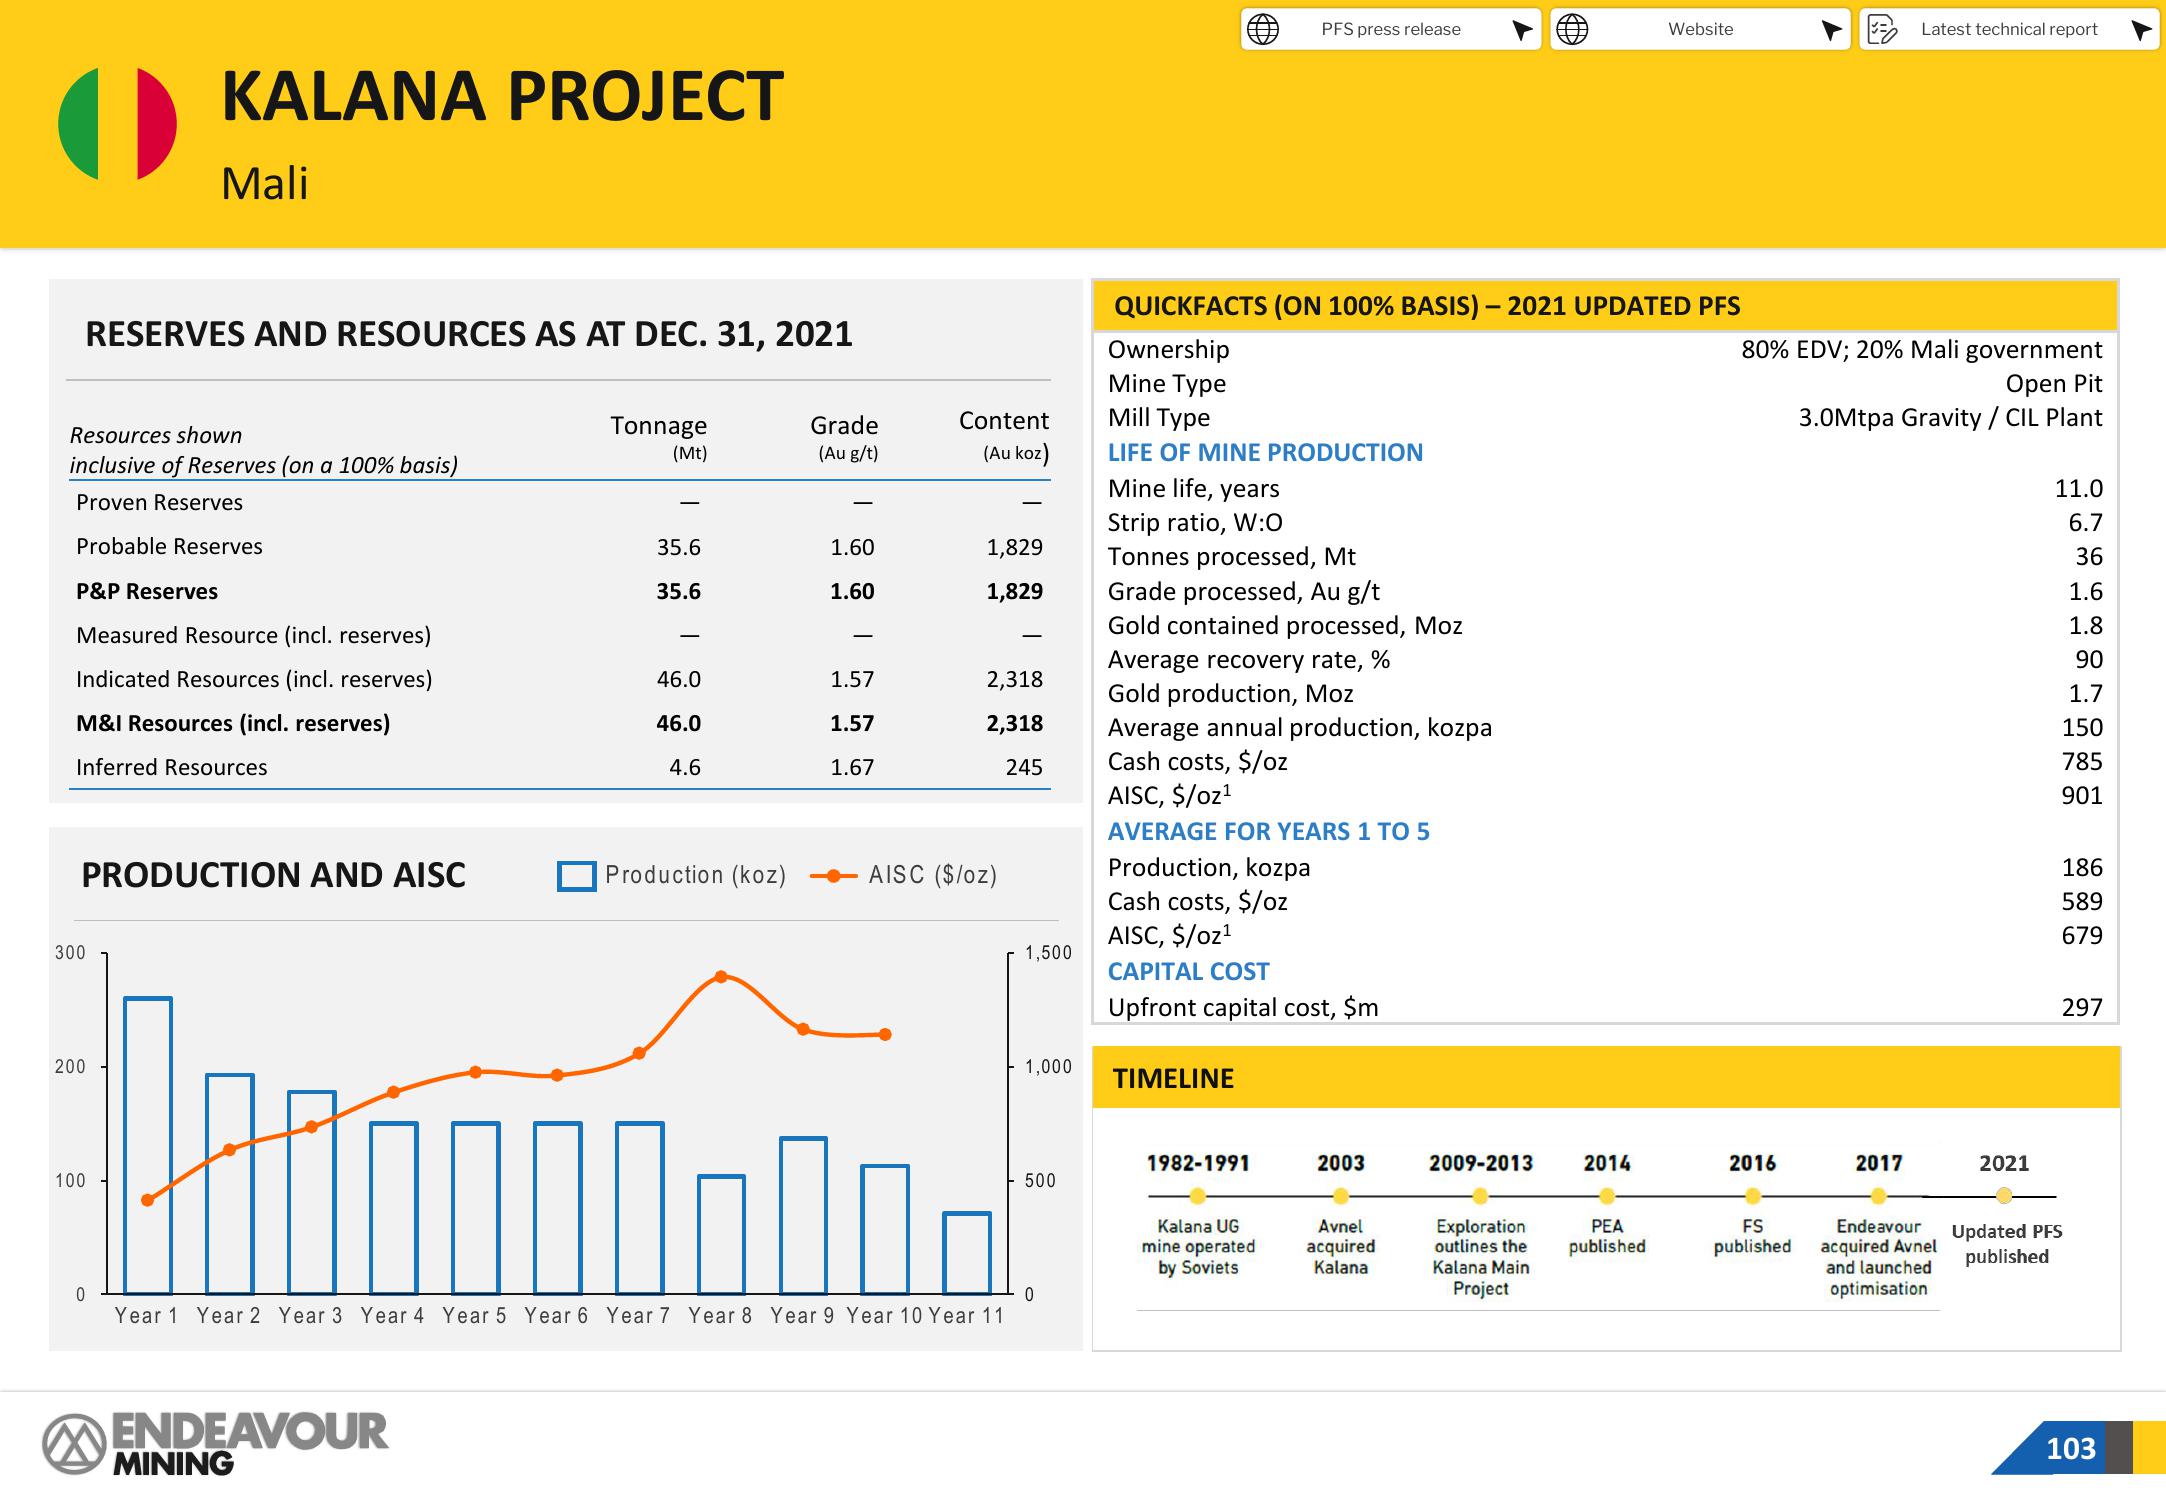
P&P Reserves
Resources shown
inclusive of Reserves (on a 100% basis)
Proven Reserves
Probable Reserves
RESERVES AND RESOURCES AS AT DEC. 31, 2021
KALANA PROJECT
Measured Resource (incl. reserves)
Indicated Resources (incl. reserves)
M&I Resources (incl. reserves)
Inferred Resources
300
200
Mali
PRODUCTION AND AISC
100
0
ENDEAVOUR
Tonnage
(Mt)
MINING
35.6
35.6
46.0
46.0
4.6
Production (koz)
Grade
(Au g/t)
1.60
1.60
1.57
1.57
1.67
Content
(Au koz)
1,829
1,829
2,318
2,318
245
ISC ($/oz)
1,500
00000
0
Year 1 Year 2 Year 3 Year 4 Year 5 Year 6 Year 7 Year 8 Year 9 Year 10 Year 11
1,000
500
QUICKFACTS (ON 100% BASIS) - 2021 UPDATED PFS
Ownership
Mine Type
Mill Type
LIFE OF MINE PRODUCTION
Mine life, years
Strip ratio, W:0
Tonnes processed, Mt
Grade processed, Au g/t
Gold contained processed, Moz
Average recovery rate, %
Gold production, Moz
Average annual production, kozpa
Cash costs, $/oz
AISC, $/oz¹
PFS press release
AVERAGE FOR YEARS 1 TO 5
Production, kozpa
Cash costs, $/oz
AISC, $/oz¹
CAPITAL COST
Upfront capital cost, $m
TIMELINE
1982-1991
Kalana UG
mine operated
by Soviets
2003
Avnel
acquired
Kalana
2009-2013
Exploration
outlines the
Kalana Main
Project
2014
Website
PEA
published
80% EDV; 20% Mali government
Open Pit
3.0Mtpa Gravity / CIL Plant
2016
FS
published
Latest technical report
2017
Endeavour
acquired Avnel
and launched
optimisation
2021
11.0
6.7
36
1.6
1.8
90
1.7
150
785
901
186
589
679
297
Updated PFS
published
103View entire presentation