AeroFarms SPAC Presentation Deck
AeroFarms Financial Overview
FARM COUNT¹
% growth
of towers
■144 grow tower farms
■ 48 grow tower farms
%
margin
48
1
# of towers
2021
$(2)
2021
192
NM
2022
300%
GROSS PROFIT ($mm)
$(3)
2022
432
7
6
NM
2023
125%
$11
2023
768
10
3
19%
7
2024
78%
$57
2024
1,008
13
4
35%
9
2025
31%
$137
2025
42%
1,248
16
5
1 New farms that are under construction or operating
11
2026
24%
$264
2026
1,248
16
5
48%
11
Run Rate
NM
$423
Run Rate
REVENUE ($mm)
51%
% growth
$4
2021
$(391
EBITDA ($mm)
2021
$13
2022
226%
NM
$(47)
2022
$54
NM
2023
305%
$(49)
2023
$163
2024
NM
201%
$(4)
2024
$330
NM
2025
102%
$82
%
margin
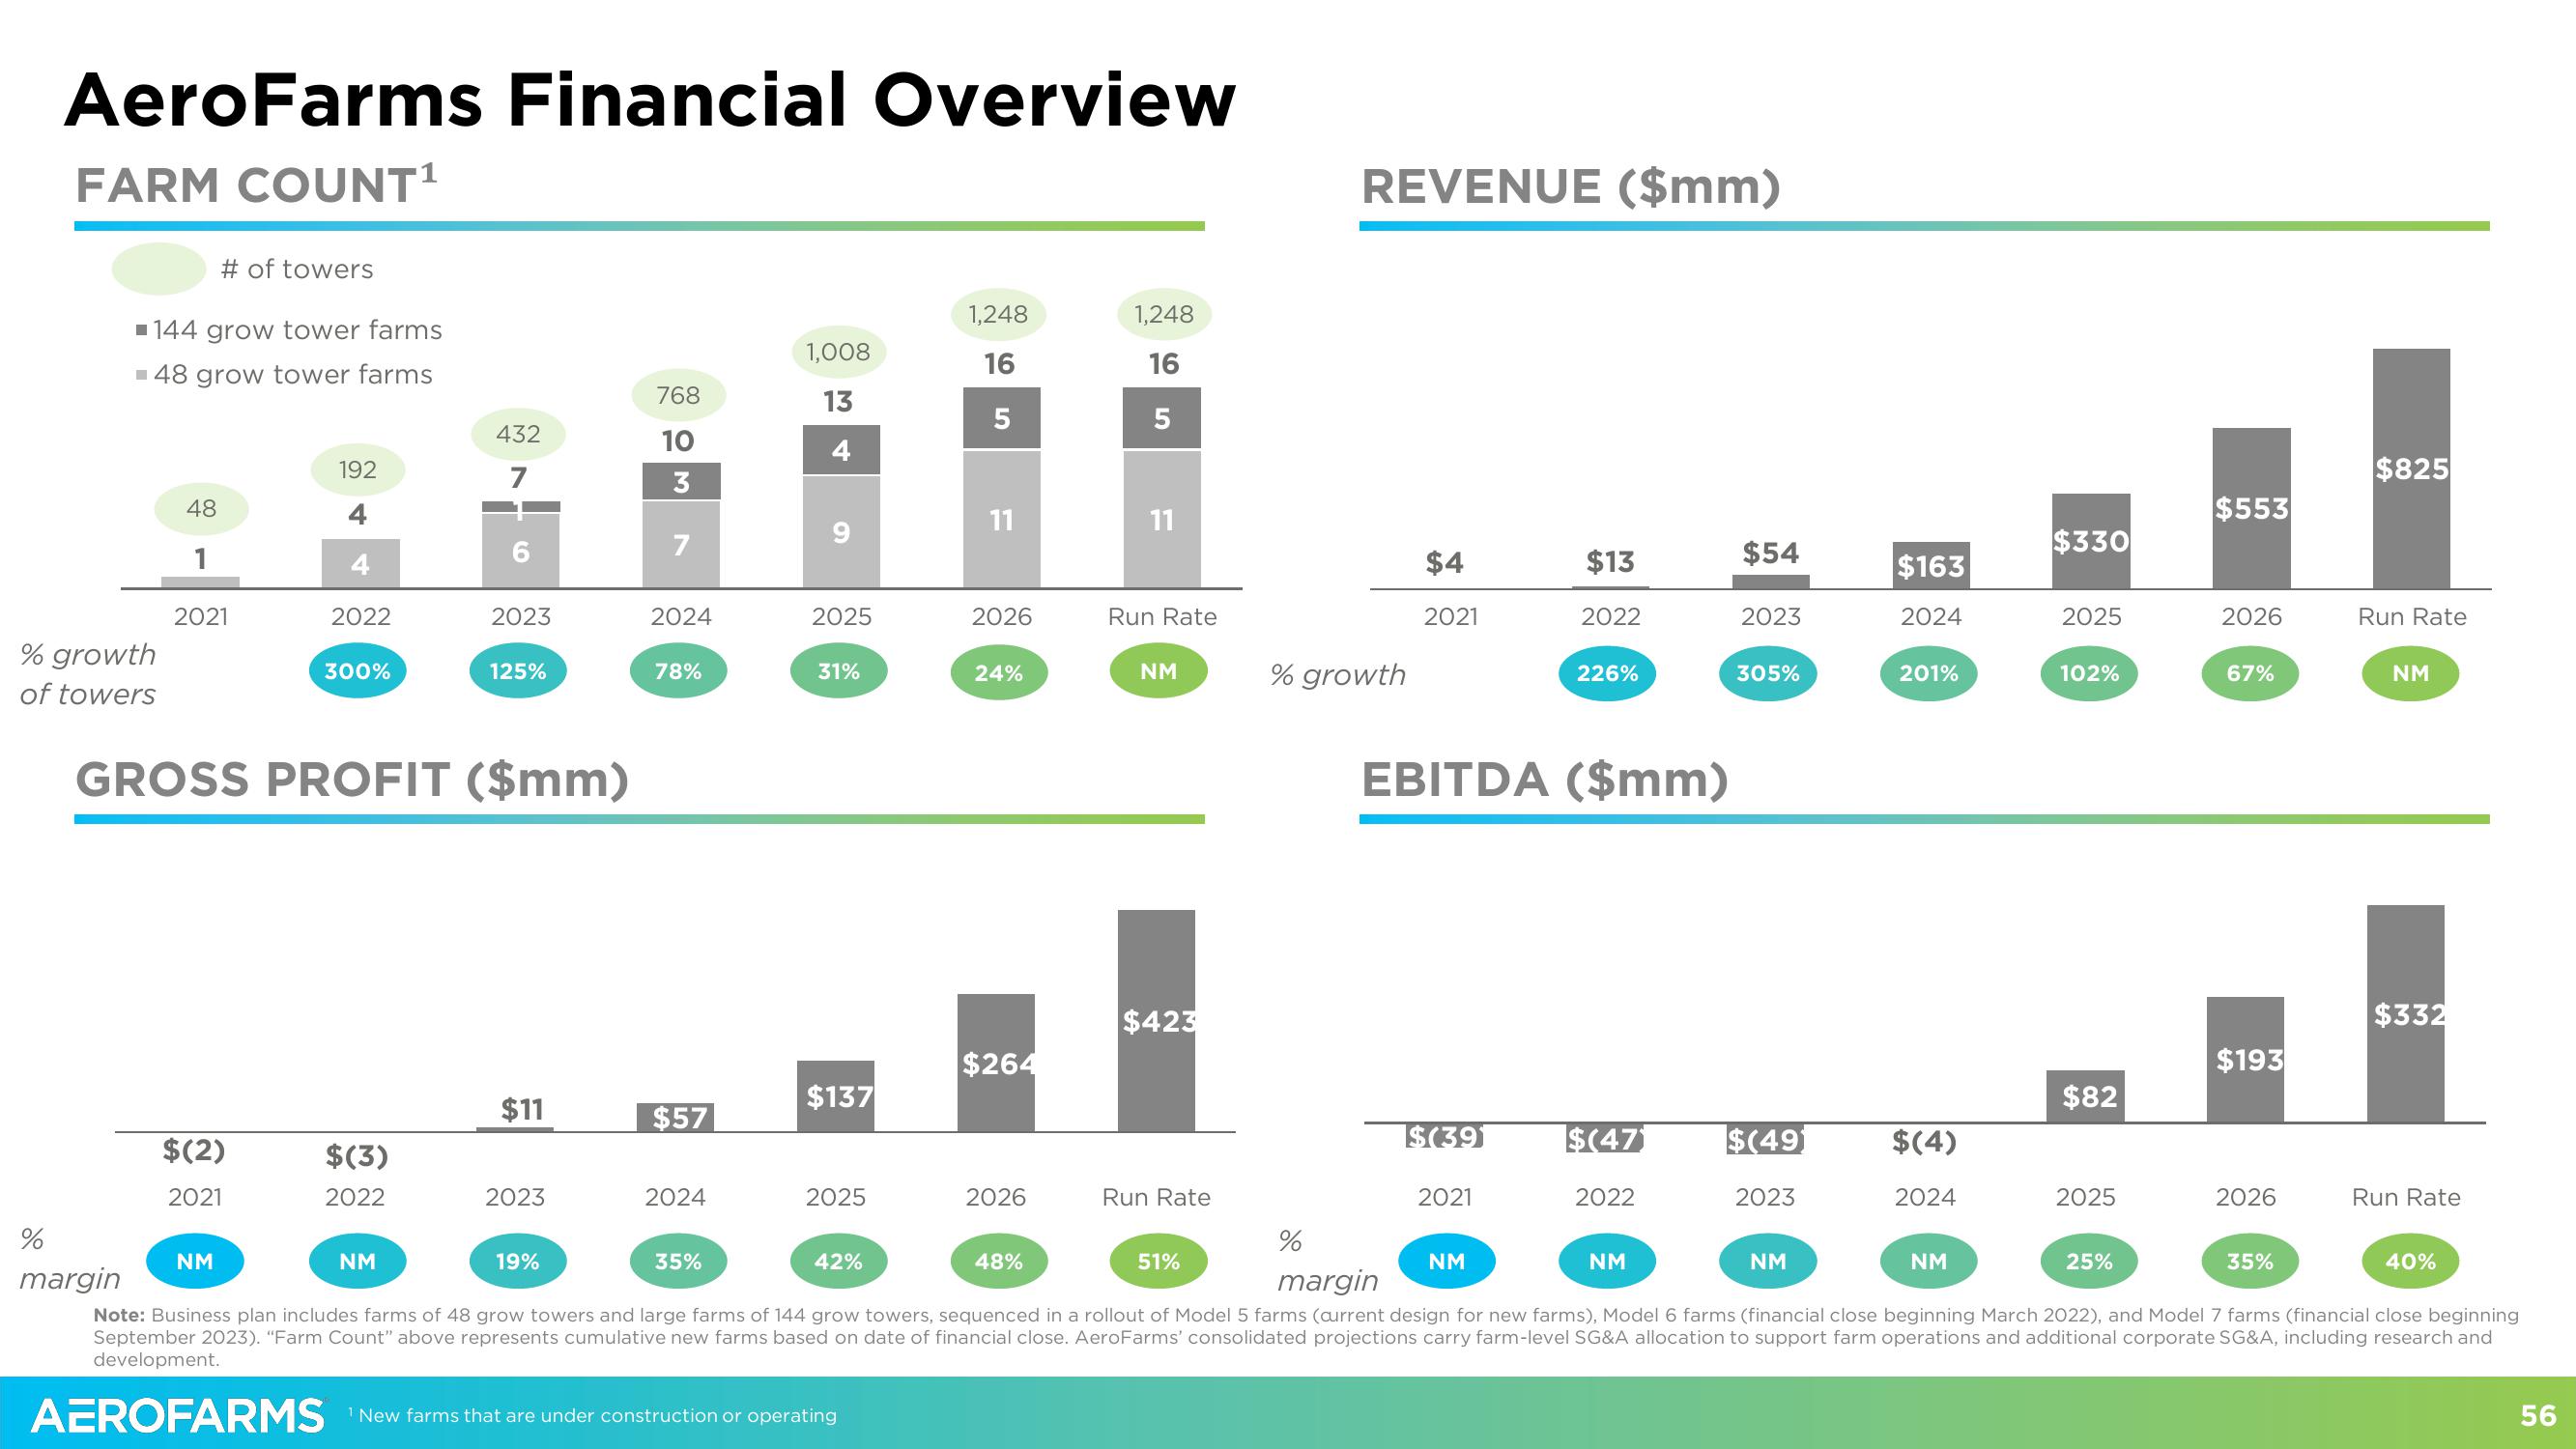
Note: Business plan includes farms of 48 grow towers and large farms of 144 grow towers, sequenced in a rollout of Model 5 farms (current design for new farms), Model 6 farms (financial close beginning March 2022), and Model 7 farms (financial close beginning
September 2023). "Farm Count" above represents cumulative new farms based on date of financial close. AeroFarms' consolidated projections carry farm-level SG&A allocation to support farm operations and additional corporate SG&A, including research and
development.
AEROFARMS
2025
$553
25%
2026
67%
$193
2026
$825
35%
Run Rate
NM
$332
Run Rate
40%
56View entire presentation