Affirm Results Presentation Deck
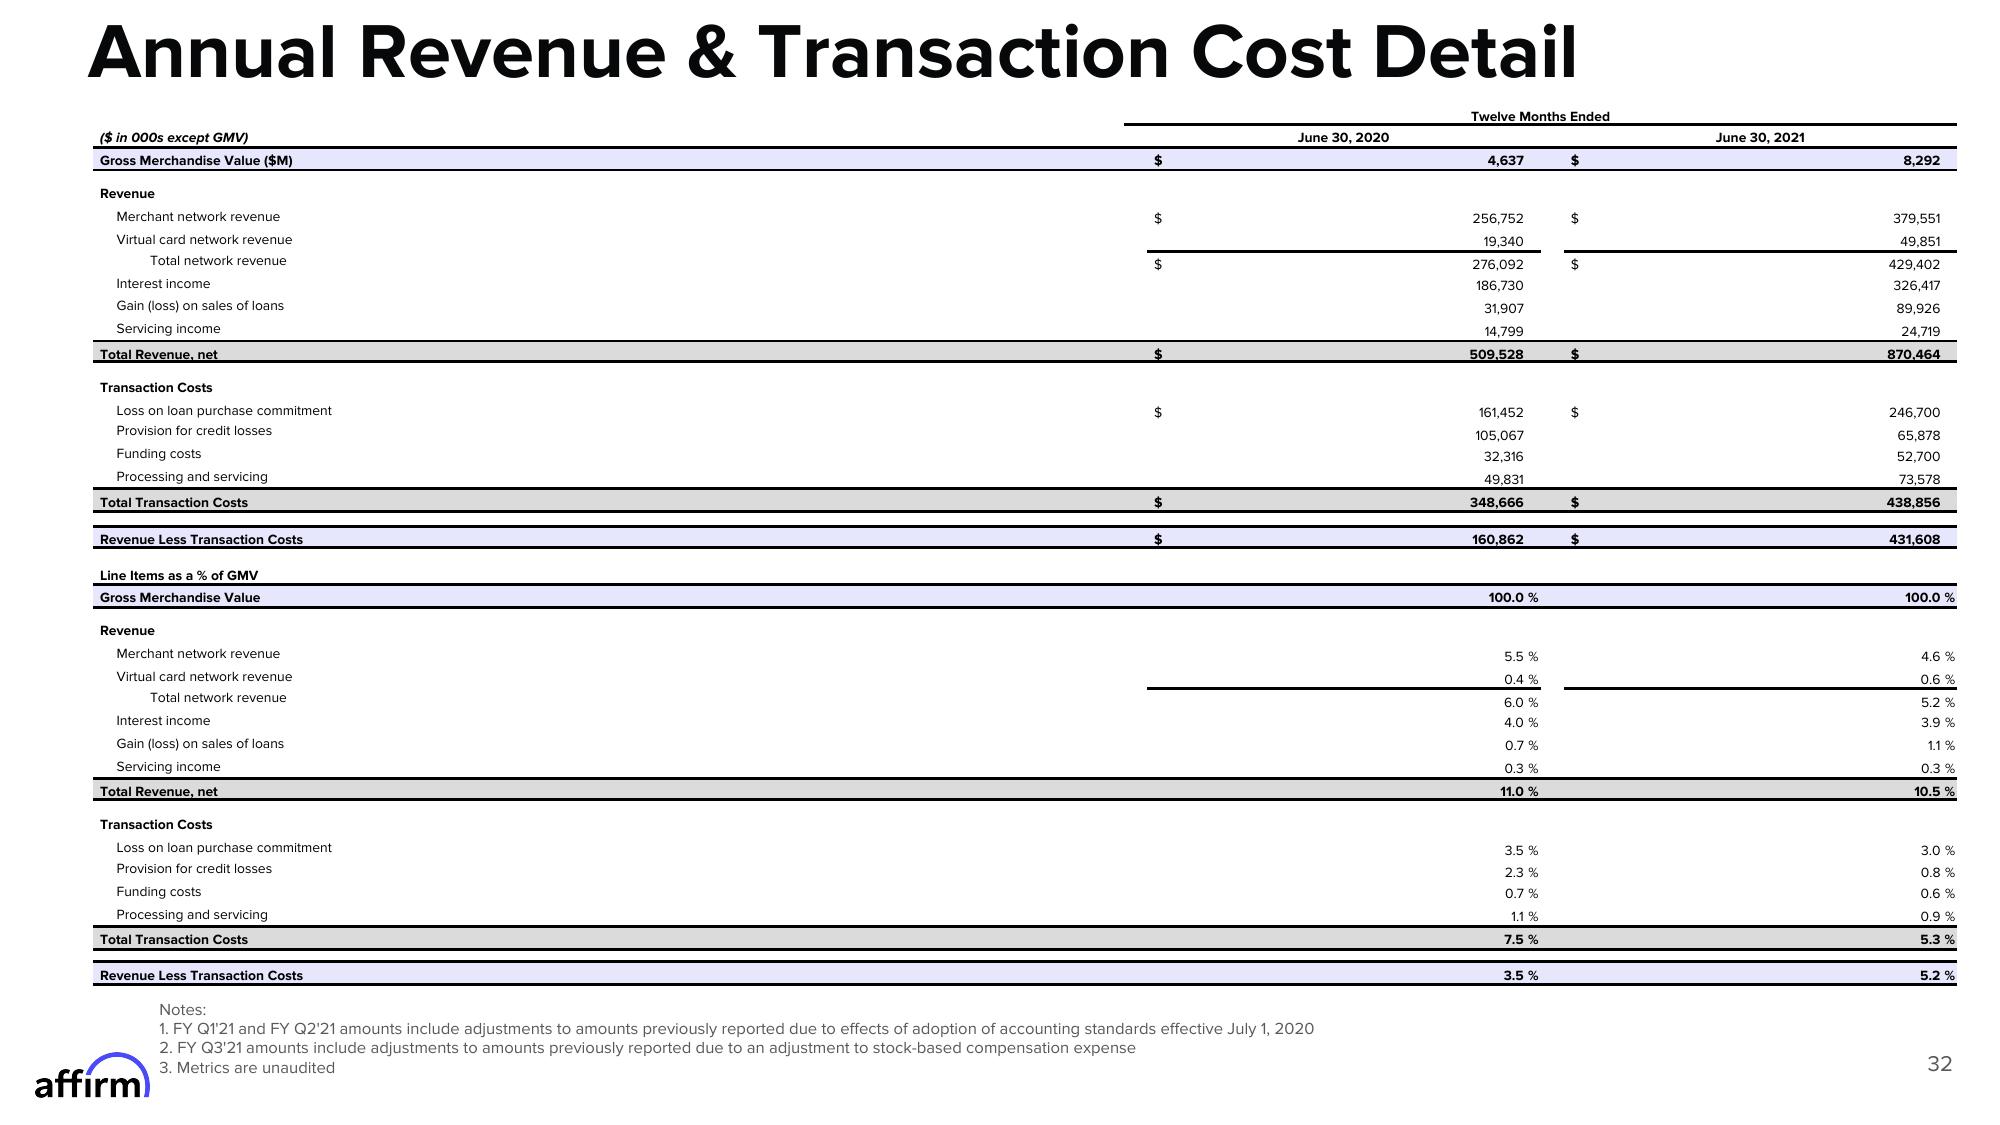
Annual Revenue & Transaction Cost Detail
($ in 000s except GMV)
Gross Merchandise Value ($M)
Revenue
Merchant network revenue
Virtual card network revenue
Total network revenue
Interest income
Gain (loss) on sales of loans
Servicing income
Total Revenue, net
Transaction Costs
Loss on loan purchase commitment
Provision for credit losses
Funding costs
Processing and servicing
Total Transaction Costs
Revenue Less Transaction Costs
Line Items as a % of GMV
Gross Merchandise Value
Revenue
Merchant network revenue
Virtual card network revenue
Total network revenue
Interest income
Gain (loss) on sales of loans
Servicing income
Total Revenue, net
Transaction Costs
Loss on loan purchase commitment
Provision for credit losses
Funding costs
Processing and servicing
Total Transaction Costs
Revenue Less Transaction Costs
affirm
$
$
$
$
$
$
June 30, 2020
Notes:
1. FY Q1'21 and FY Q2'21 amounts include adjustments to amounts previously reported due to effects of adoption of accounting standards effective July 1, 2020
2. FY Q3'21 amounts include adjustments to amounts previously reported due to an adjustment to stock-based compensation expense
3. Metrics are unaudited
Twelve Months Ended
4,637
256,752
19,340
276,092
186,730
31,907
14,799
509,528
161,452
105,067
32,316
49,831
348,666
160,862
100.0 %
5.5 %
0.4 %
6.0 %
4.0 %
0.7 %
0.3 %
11.0 %
3.5 %
2.3 %
0.7 %
1.1 %
7.5 %
3.5 %
$
$
$
$
$
$
$
June 30, 2021
8,292
379,551
49,851
429,402
326,417
89,926
24,719
870,464
246,700
65,878
52,700
73,578
438,856
431,608
100.0 %
4.6 %
0.6 %
5.2 %
3.9 %
1.1 %
0.3%
10.5 %
3.0 %
0.8%
0.6 %
0.9 %
5.3%
5.2 %
32View entire presentation