Zegna Results Presentation Deck
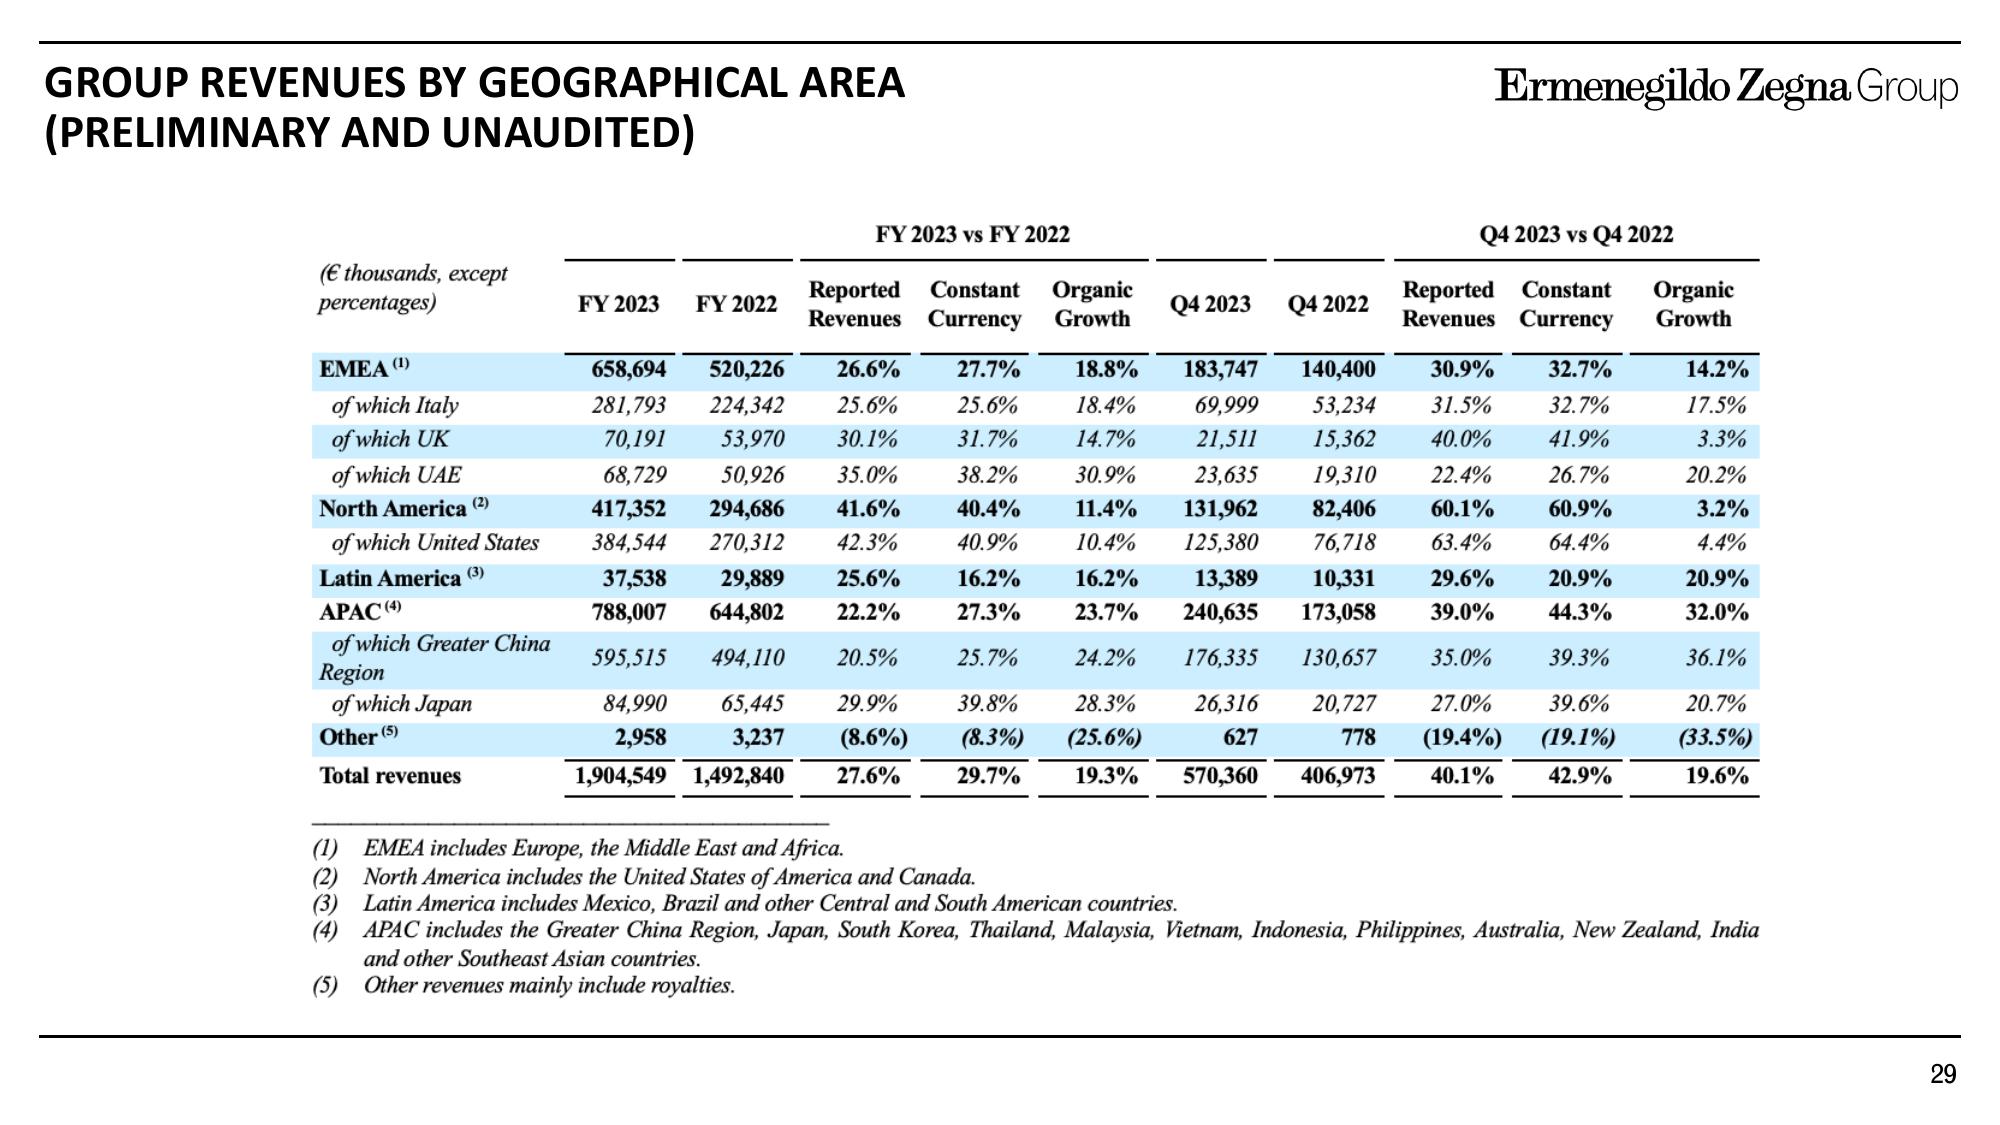
GROUP REVENUES BY GEOGRAPHICAL AREA
(PRELIMINARY AND UNAUDITED)
(€ thousands, except
percentages)
EMEA (¹)
of which Italy
of which UK
of which UAE
North America (²)
of which United States
Latin America (3)
APAC (4)
of which Greater China
Region
of which Japan
Other (5)
Total revenues
FY 2023
FY 2022
FY 2023 vs FY 2022
Reported Constant Organic
Revenues Currency Growth
658,694 520,226 26.6%
281,793 224,342 25.6%
70,191 53,970 30.1%
68,729 50,926 35.0%
417,352 294,686 41.6%
384,544 270,312 42.3%
37,538 29,889 25.6%
788,007 644,802 22.2%
595,515 494,110
20.5%
65,445 29.9%
84,990
2,958
3,237
(8.6%)
1,904,549 1,492,840
27.6%
27.7%
25.6%
31.7%
38.2%
40.4%
40.9%
16.2%
27.3%
25.7%
39.8%
(8.3%)
29.7%
(1) EMEA includes Europe, the Middle East and Africa.
(2) North America includes the United States of America and Canada.
Q4 2023
Q4 2022
Ermenegildo Zegna Group
Q4 2023 vs Q4 2022
Reported Constant Organic
Revenues Currency Growth
32.7%
32.7%
41.9%
26.7%
60.9%
64.4%
18.8%
18.4%
14.7%
183,747 140,400 30.9%
69,999 53,234 31.5%
21,511 15,362 40.0%
30.9% 23,635 19,310 22.4%
11.4% 131,962 82,406 60.1%
10.4% 125,380 76,718 63.4%
16.2% 13,389 10,331 29.6%
23.7% 240,635 173,058 39.0%
20.9%
44.3%
39.3%
24.2%
176,335 130,657 35.0%
28.3% 26,316 20,727 27.0% 39.6%
(25.6%)
627
778 (19.4%) (19.1%)
19.3% 570,360 406,973 40.1% 42.9%
14.2%
17.5%
3.3%
20.2%
3.2%
4.4%
20.9%
32.0%
36.1%
20.7%
(33.5%)
19.6%
(3) Latin America includes Mexico, Brazil and other Central and South American countries.
(4) APAC includes the Greater China Region, Japan, South Korea, Thailand, Malaysia, Vietnam, Indonesia, Philippines, Australia, New Zealand, India
and other Southeast Asian countries.
(5)
Other revenues mainly include royalties.
29View entire presentation