OpenText Investor Presentation Deck
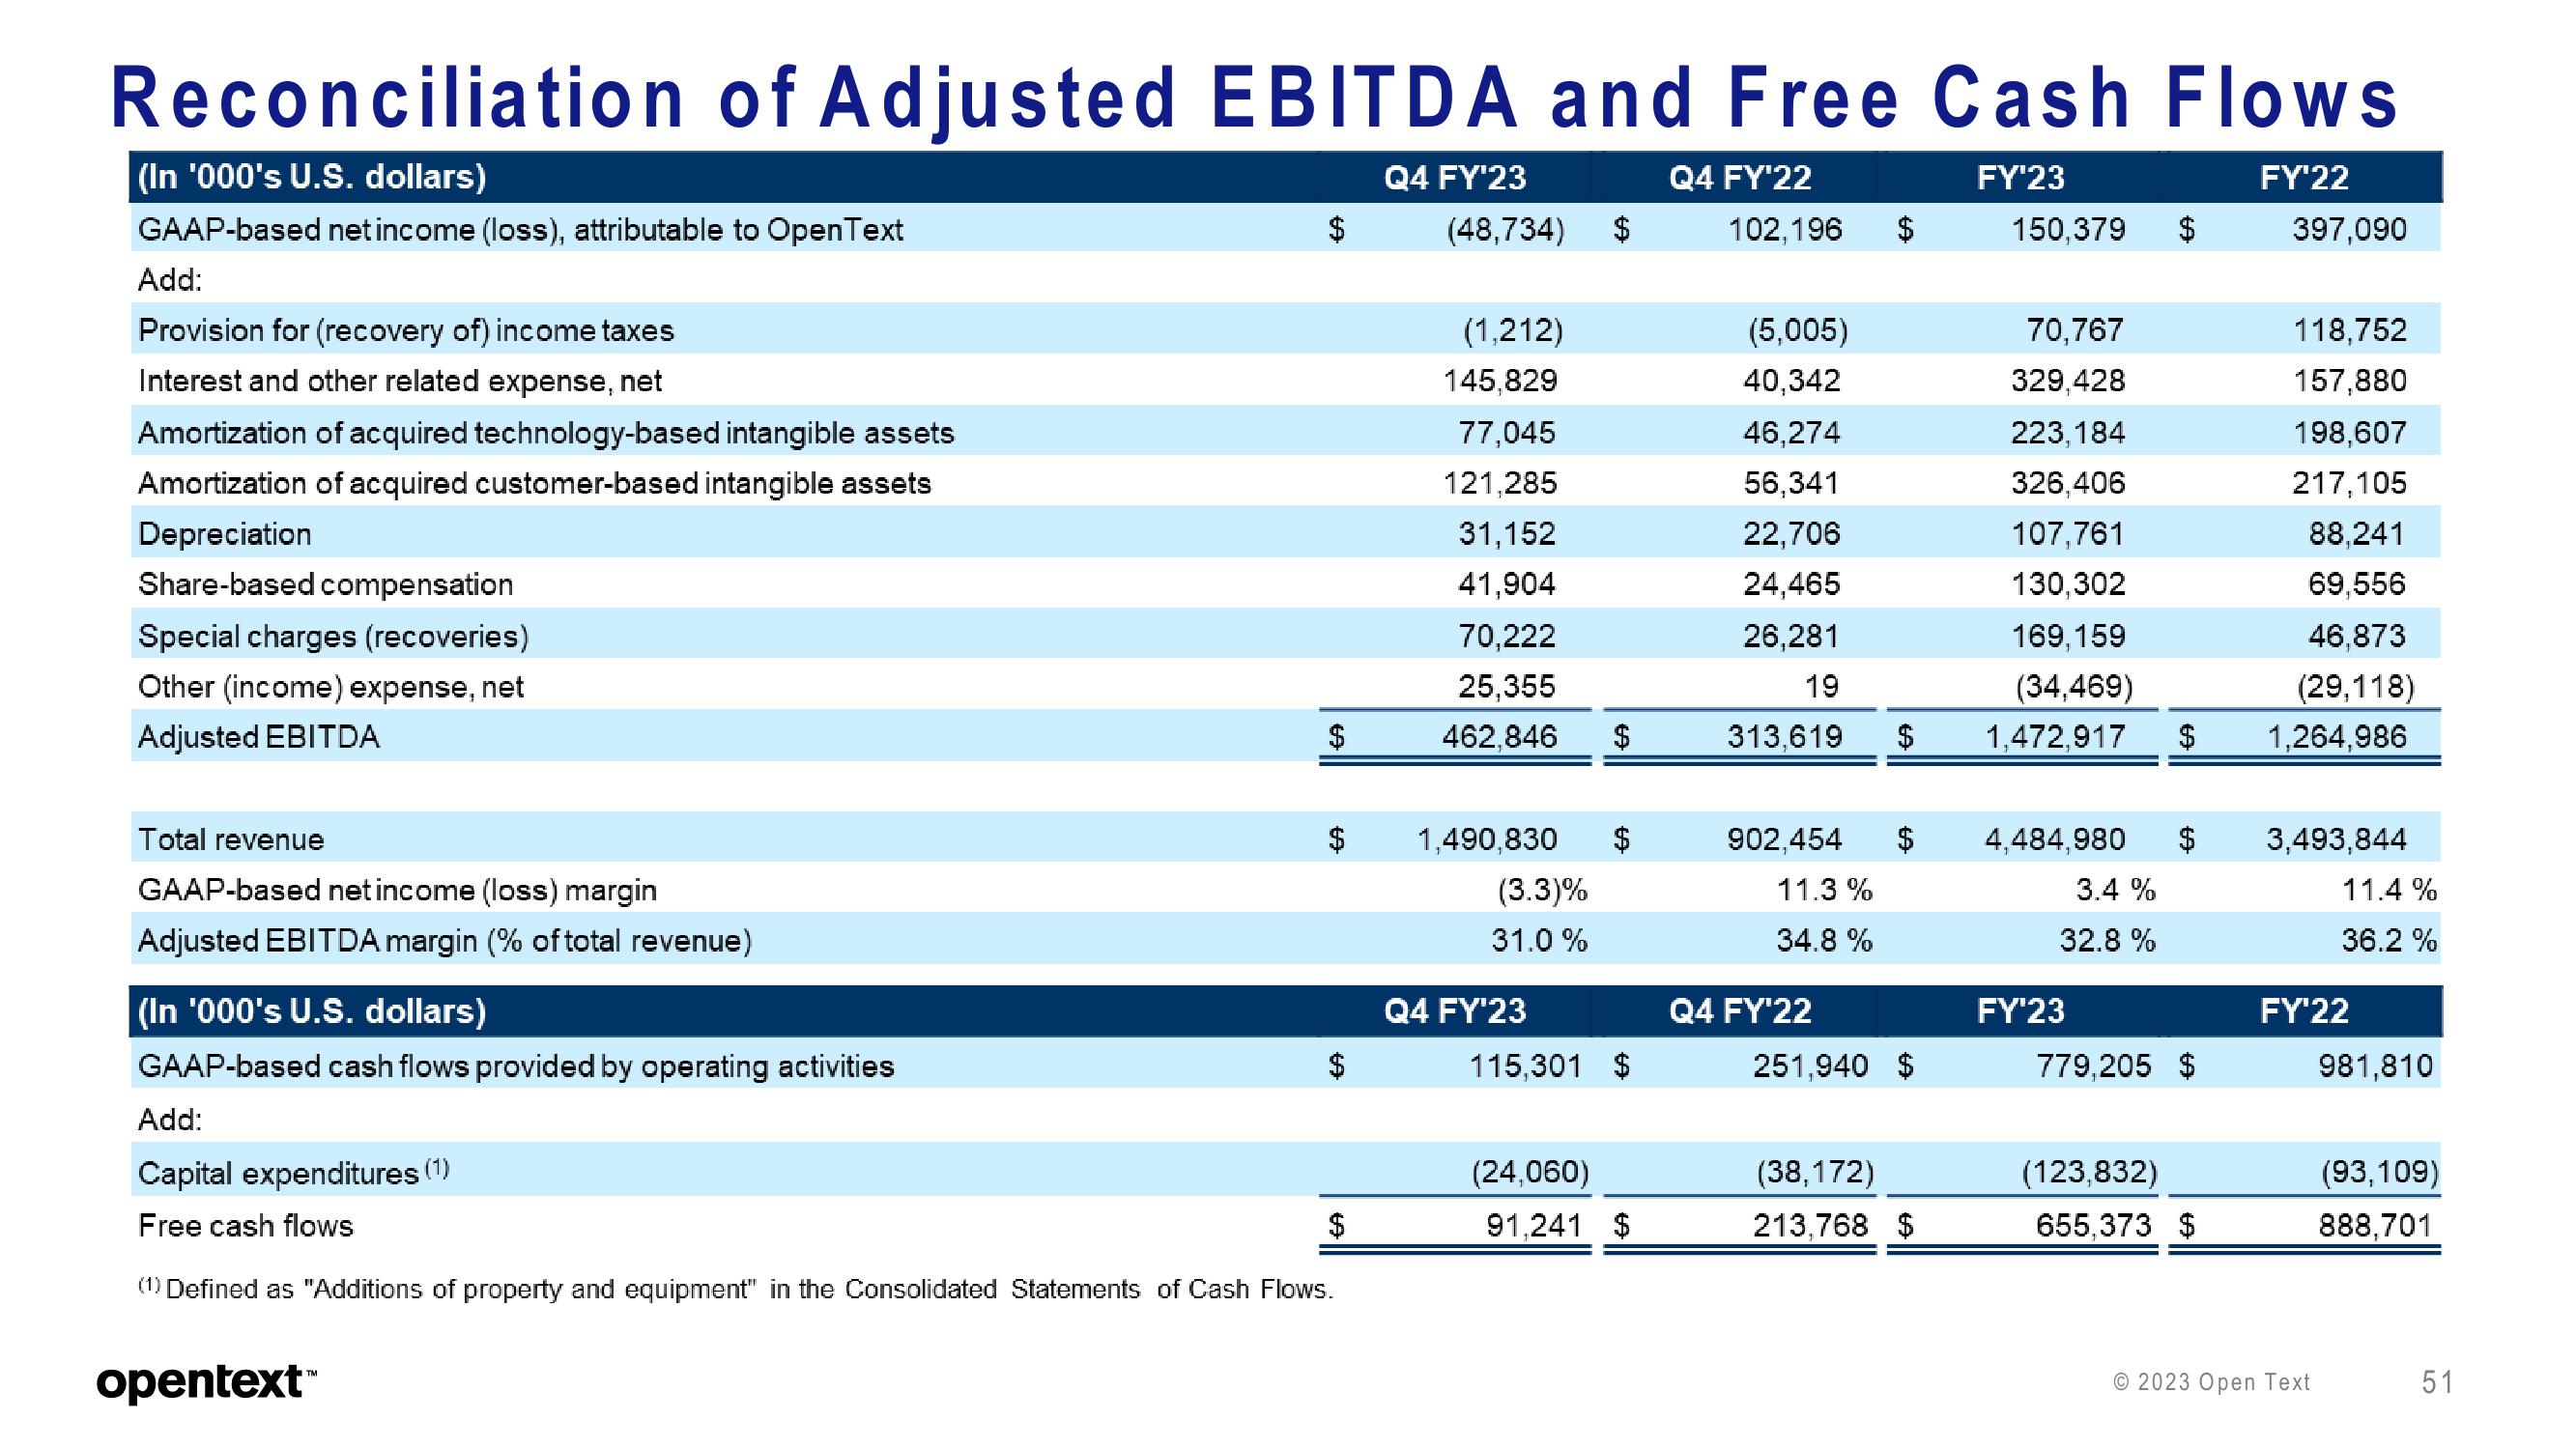
Reconciliation of Adjusted EBITDA and Free Cash Flows
(In '000's U.S. dollars)
FY'23
FY'22
GAAP-based net income (loss), attributable to Open Text
Add:
Provision for (recovery of) income taxes
Interest and other related expense, net
Amortization of acquired technology-based intangible assets
Amortization of acquired customer-based intangible assets
Depreciation
Share-based compensation
Special charges (recoveries)
Other (income) expense, net
Adjusted EBITDA
Total revenue
GAAP-based net income (loss) margin
Adjusted EBITDA margin (% of total revenue)
(In '000's U.S. dollars)
GAAP-based cash flows provided by operating activities
$
opentext™
$
$
$
Add:
Capital expenditures
Free cash flows
(1) Defined as "Additions of property and equipment" in the Consolidated Statements of Cash Flows.
$
Q4 FY'23
(48,734) $
(1,212)
145,829
77,045
121,285
31,152
41,904
70,222
25,355
462,846 $
1,490,830
(3.3)%
31.0%
Q4 FY'23
$
115,301 $
(24,060)
91,241 $
Q4 FY'22
102,196 $
(5,005)
40,342
46,274
56,341
22,706
24,465
26,281
19
313,619 $
902,454 $
11.3%
34.8 %
Q4 FY'22
251,940 $
(38,172)
213,768 $
150,379 $
70,767
329,428
223,184
326,406
107,761
130,302
169,159
(34,469)
1,472,917 $
4,484,980
3.4 %
32.8%
FY'23
$
779,205 $
(123,832)
655,373 $
397,090
118,752
157,880
198,607
217,105
88,241
69,556
46,873
(29,118)
1,264,986
3,493,844
11.4 %
36.2%
FY'22
© 2023 Open Text
981,810
(93,109)
888,701
51View entire presentation