DigitalOcean Results Presentation Deck
ņ Customer Concentration, Revenue Contribution and Growth
Sep 2023
100%
75%
50%
25%
0%
16K
633K
138K
479K
Customers
Testers
Learners
Builders
$59M
$32M
$19M
$7M
Monthly Revenue
Scalers
$1M
(figures as of
Sep-23)
Total¹
Scalers
Builders
Learners
Customer
Growth² %
y-o-y
2%
13%
8%
0%
ARPU³
$92
$1,979
$136
$15
ARR
Growth4 %
11%
13%
9%
4%
Customer
Growth2,5
q-o-q
16,785
458
3,669
12,658
Customer
Growth²%
q-o-q
3%
3%
3%
3%
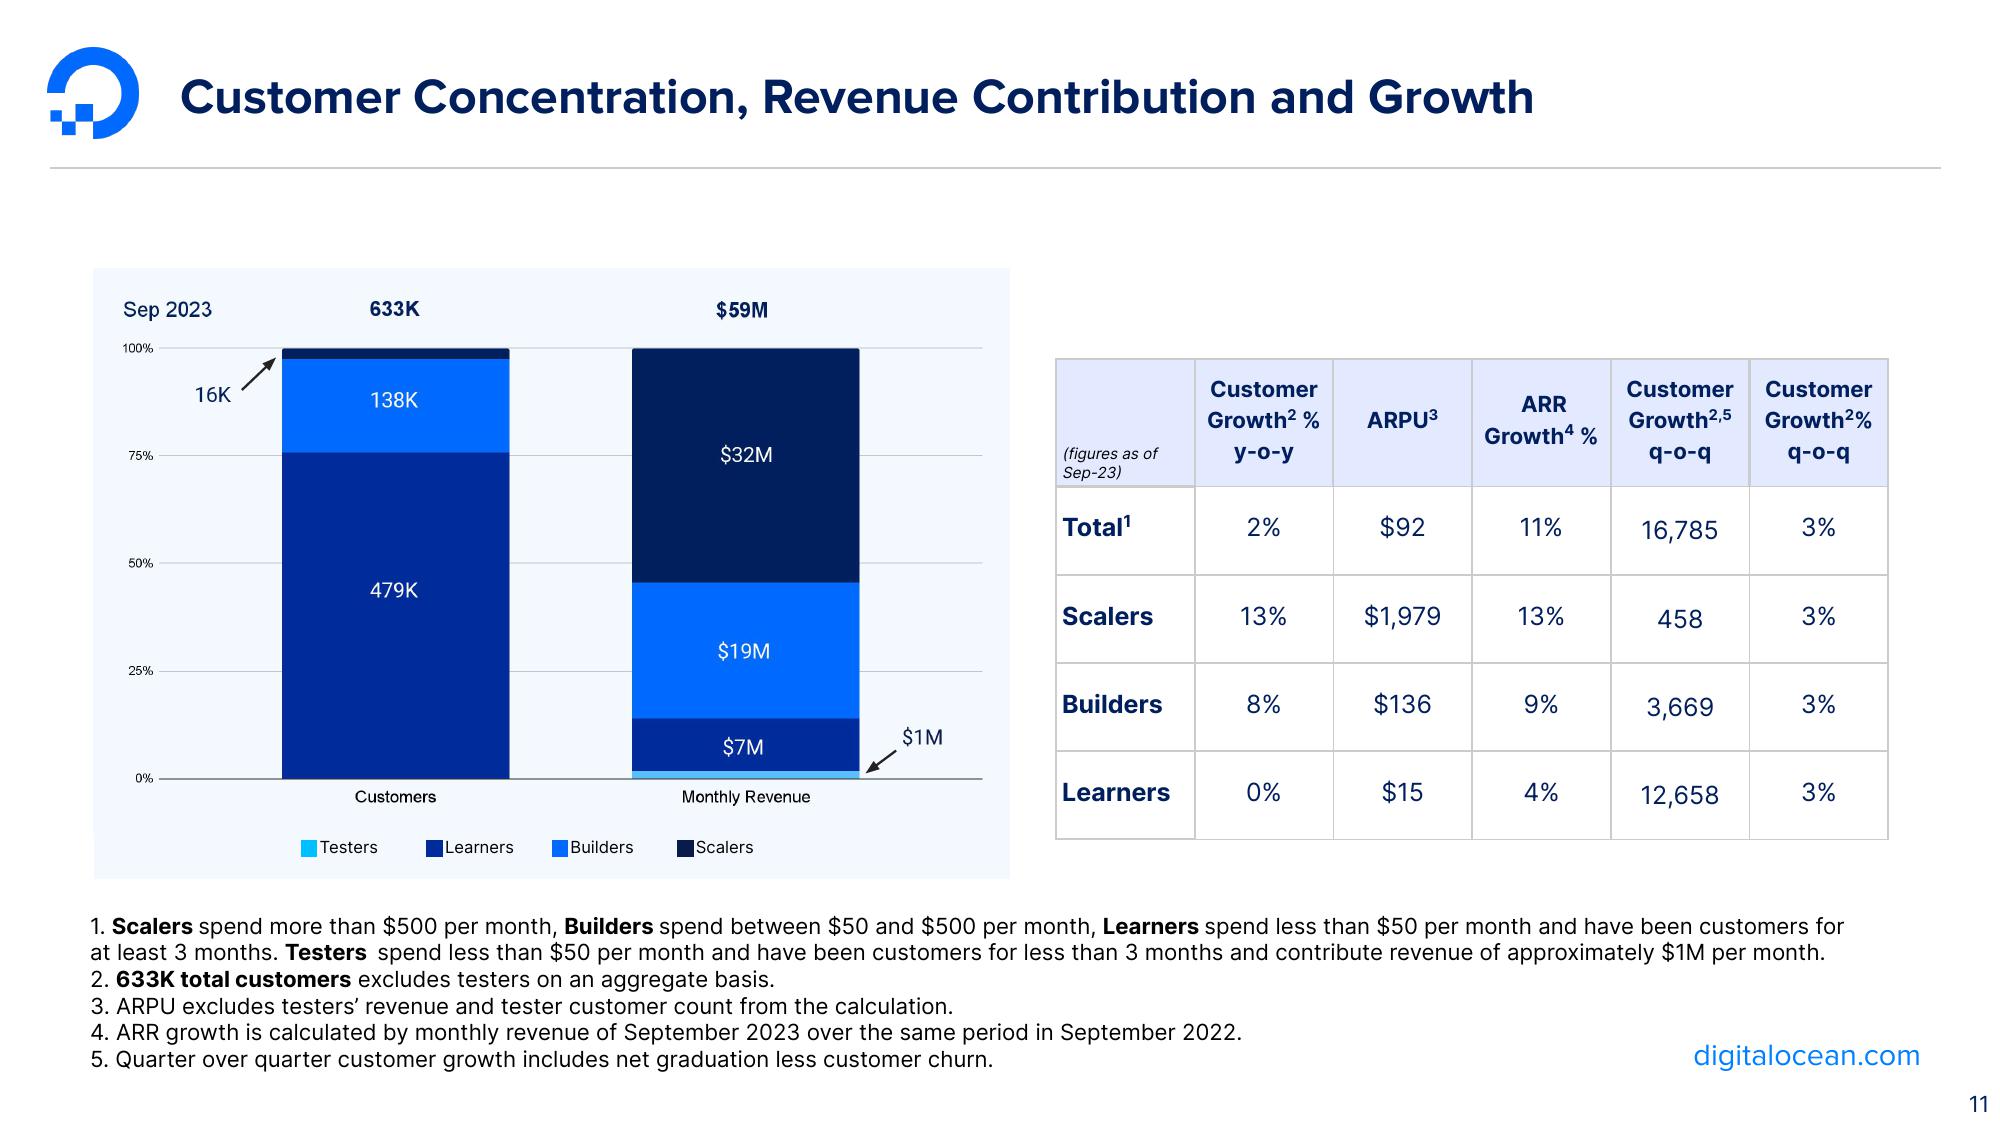
1. Scalers spend more than $500 per month, Builders spend between $50 and $500 per month, Learners spend less than $50 per month and have been customers for
at least 3 months. Testers spend less than $50 per month and have been customers for less than 3 months and contribute revenue of approximately $1M per month.
2. 633K total customers excludes testers on an aggregate basis.
3. ARPU excludes testers' revenue and tester customer count from the calculation.
4. ARR growth is calculated by monthly revenue of September 2023 over the same period in September 2022.
5. Quarter over quarter customer growth includes net graduation less customer churn.
digitalocean.com
11View entire presentation