Lyft Results Presentation Deck
Revenue
($ in millions)
$956
Q1'20
Revenue
$550
Outlook
Q1'21
+11%
$609
Actual
Q1'21
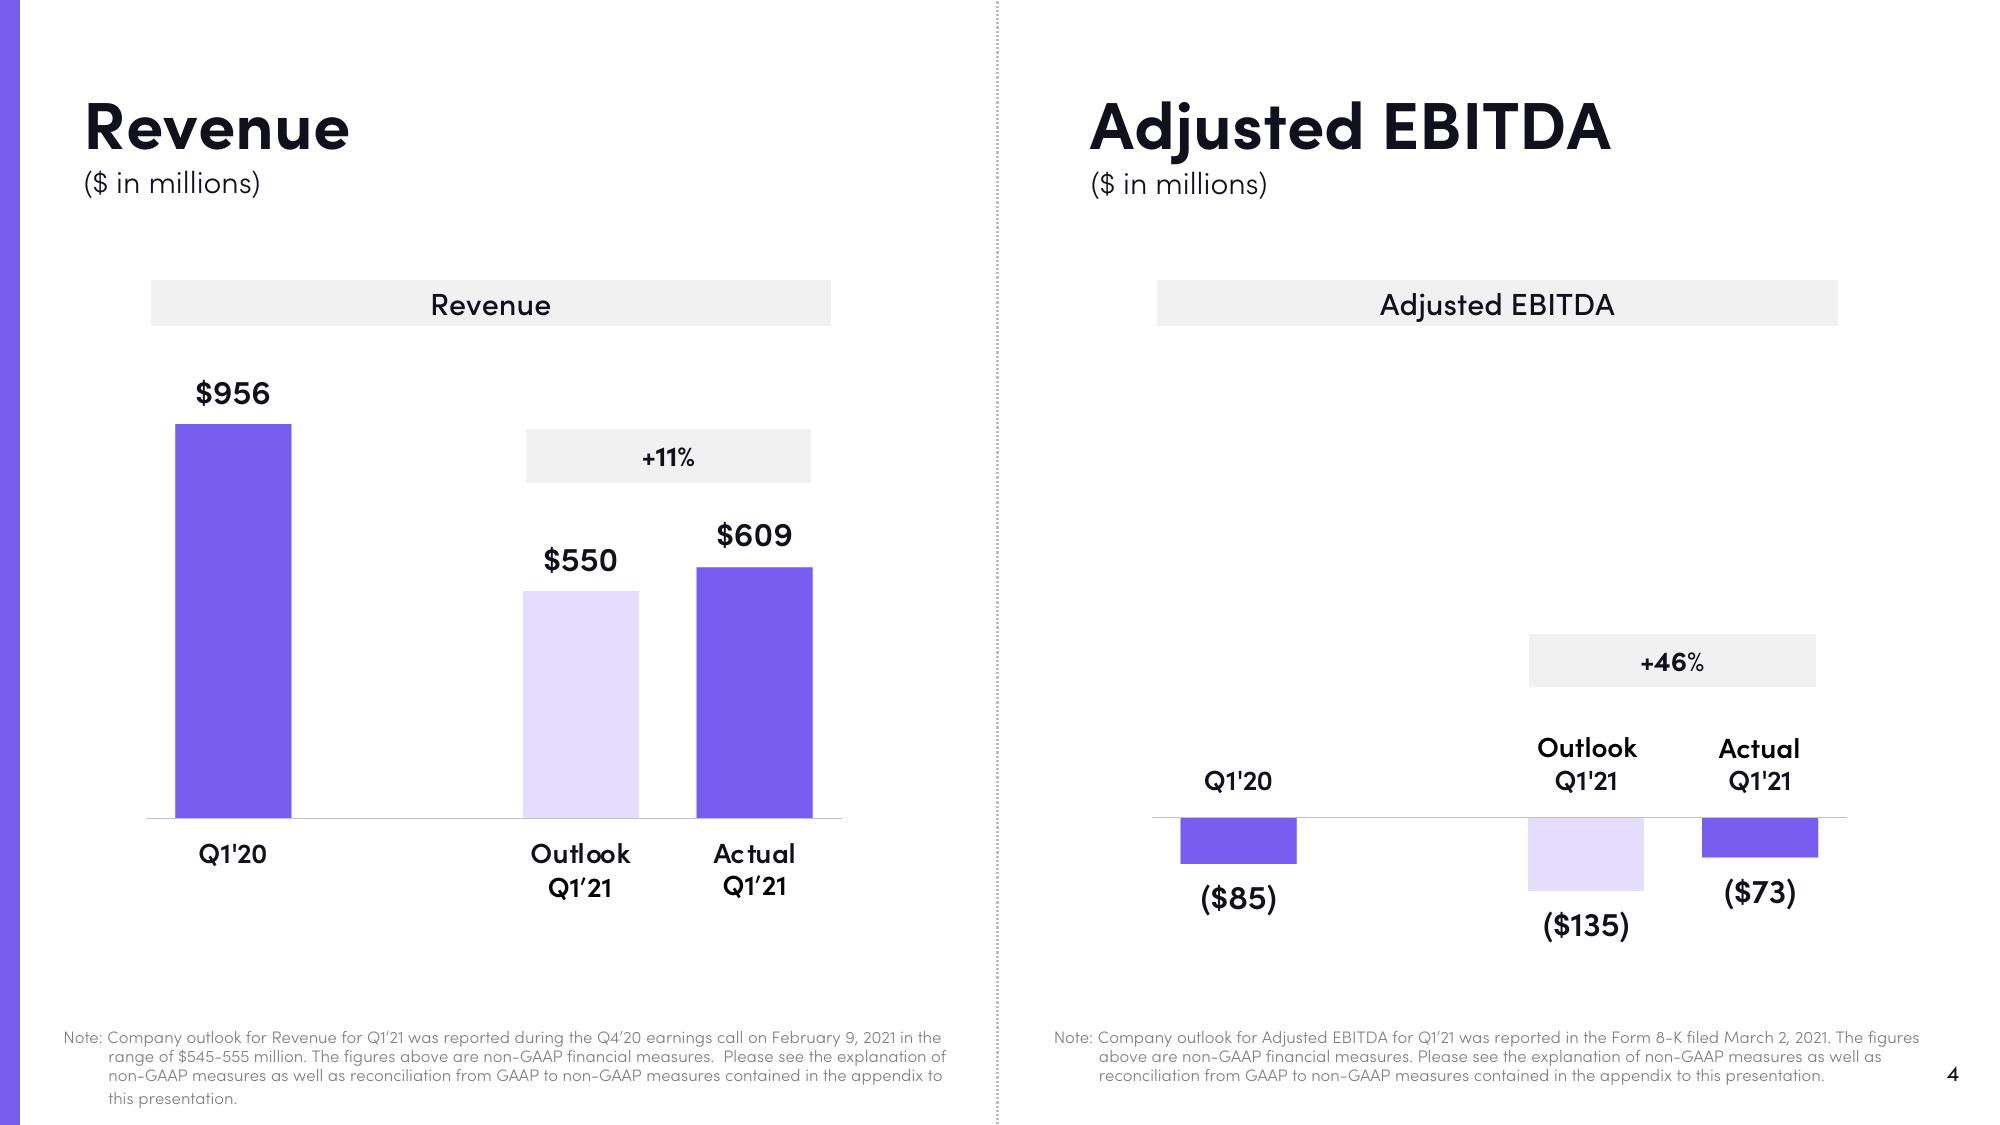
Note: Company outlook for Revenue for Q1'21 was reported during the Q4'20 earnings call on February 9, 2021 in the
range of $545-555 million. The figures above are non-GAAP financial measures. Please see the explanation of
non-GAAP measures as well as reconciliation from GAAP to non-GAAP measures contained in the appendix to
this presentation.
Adjusted EBITDA
($ in millions)
Q1'20
($85)
Adjusted EBITDA
Outlook
Q1'21
($135)
+46%
Actual
Q1'21
($73)
Note: Company outlook for Adjusted EBITDA for Q1'21 was reported in the Form 8-K filed March 2, 2021. The figures
above are non-GAAP financial measures. Please see the explanation of non-GAAP measures as well as
reconciliation from GAAP to non-GAAP measures contained in the appendix to this presentation.
4View entire presentation