WeWork Restructuring Presentation Deck
Wholly-Owned Financial Performance
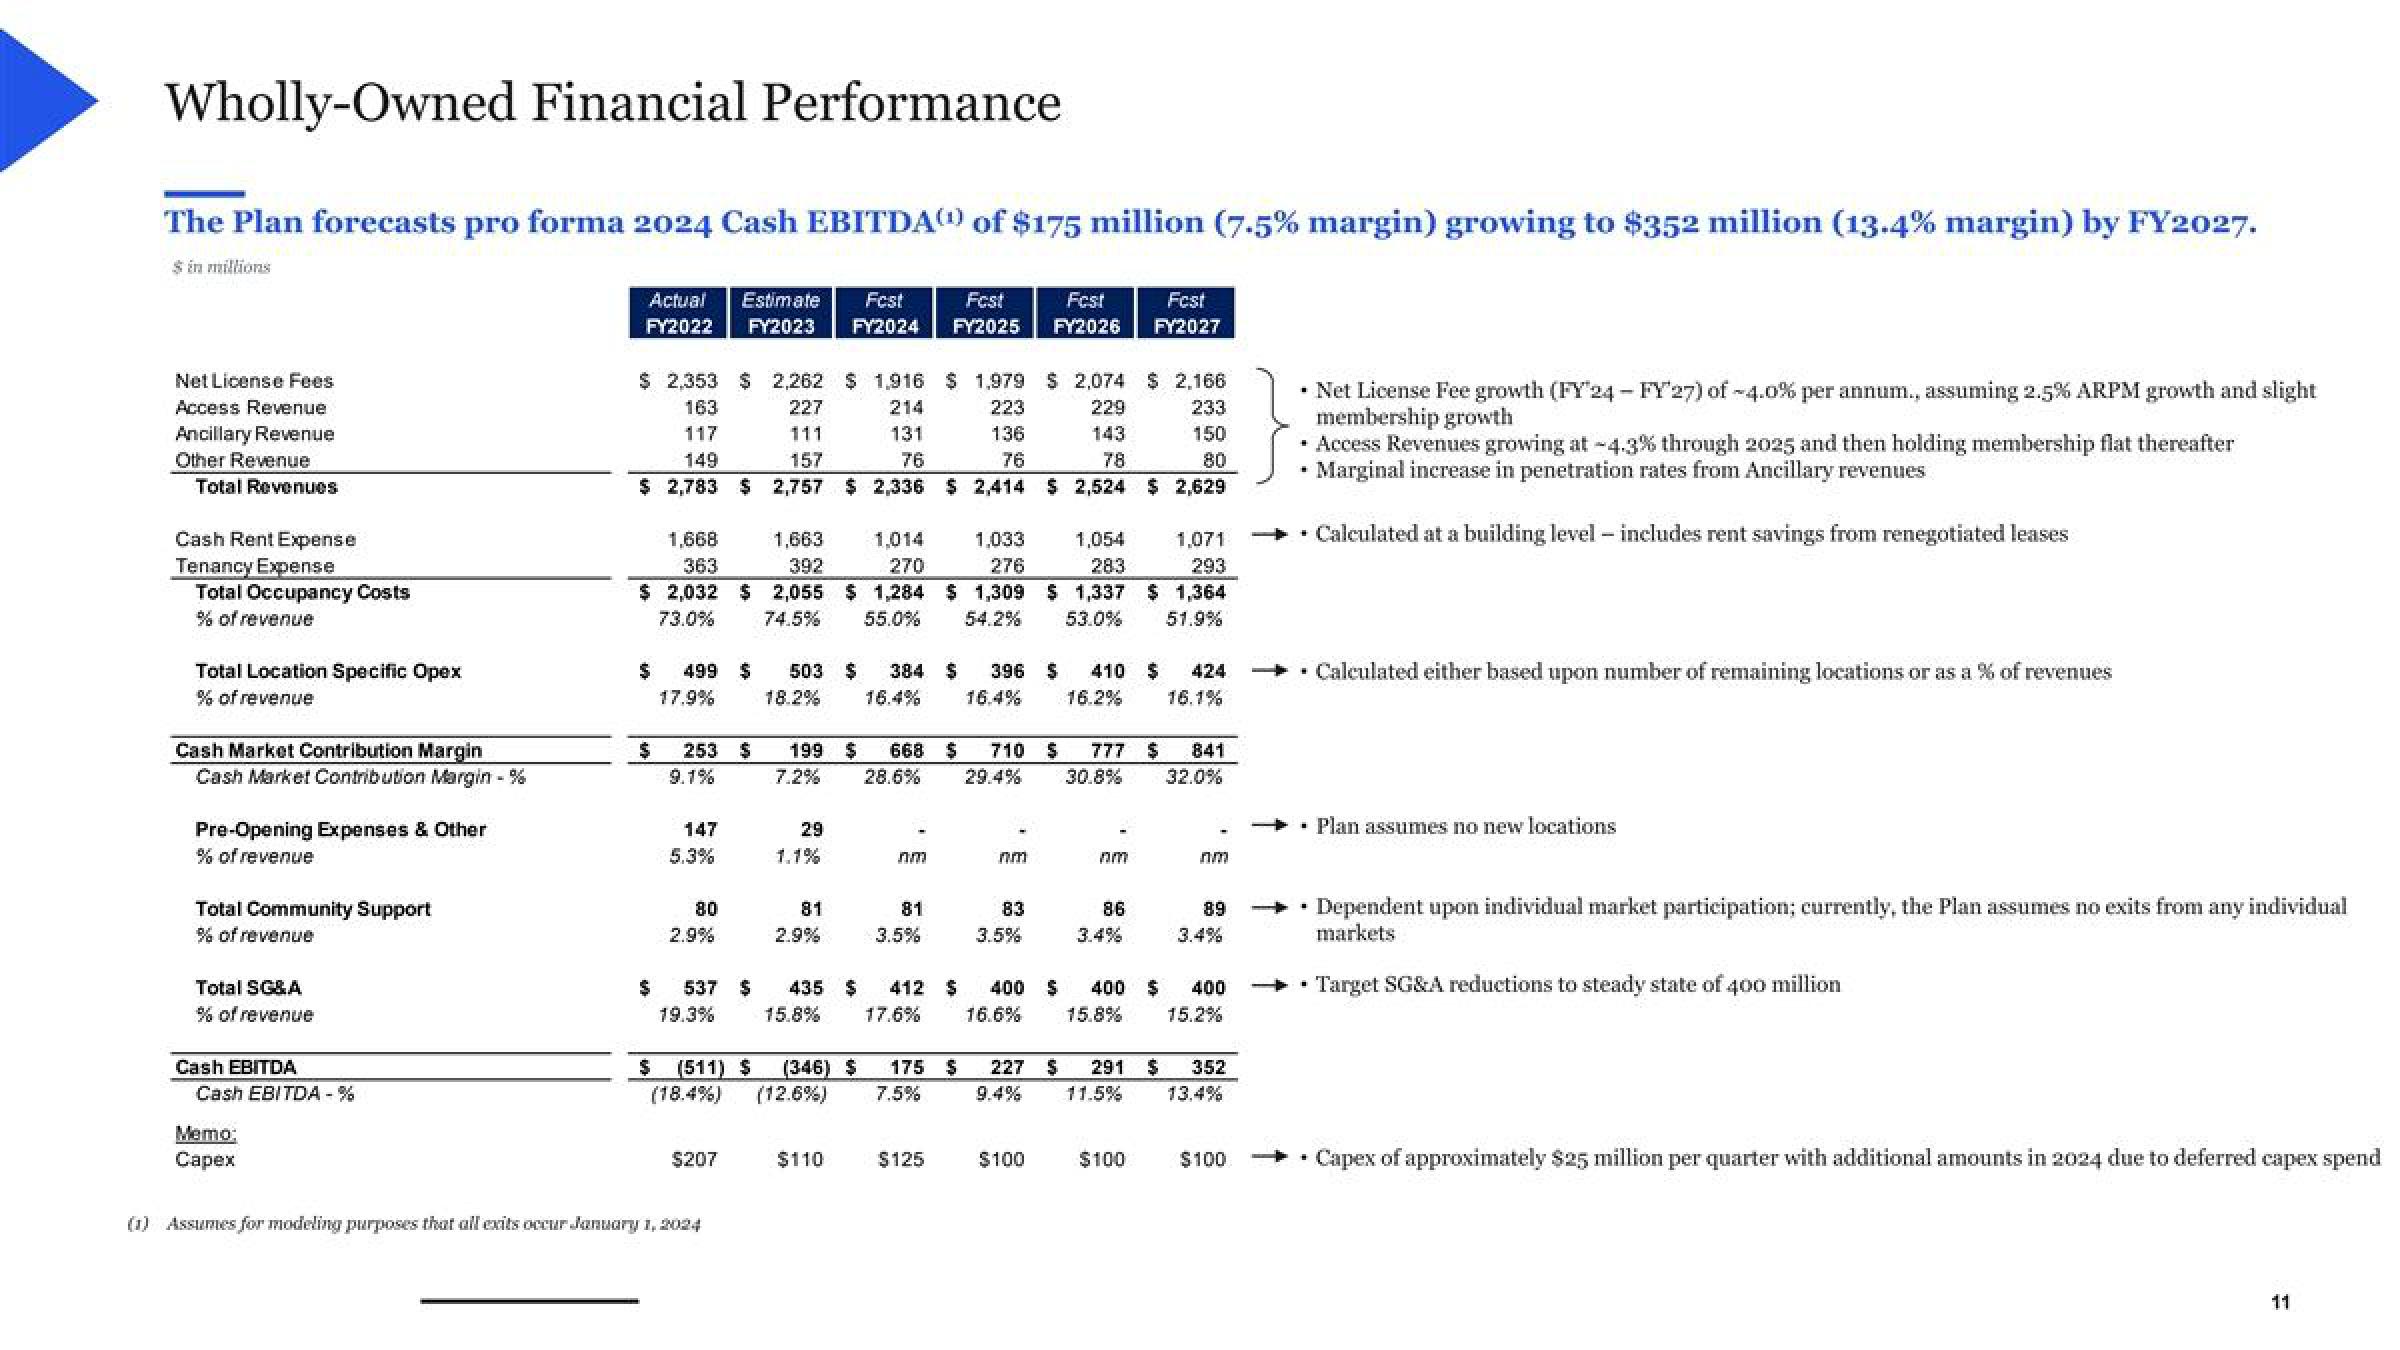
The Plan forecasts pro forma 2024 Cash EBITDA) of $175 million (7.5% margin) growing to $352 million (13.4% margin) by FY2027.
$ in millions
Net License Fees
Access Revenue
Ancillary Revenue
Other Revenue
Total Revenues
Cash Rent Expense
Tenancy Expense
Total Occupancy Costs
% of revenue
Total Location Specific Opex
% of revenue
Cash Market Contribution Margin
Cash Market Contribution Margin - %
Pre-Opening Expenses & Other
% of revenue
Total Community Support
% of revenue
Total SG&A
% of revenue
Cash EBITDA
Cash EBITDA-%
Memo:
Capex
Actual Estimate Fest Fest
Fest
FY2022 FY2023 FY2024 FY2025 FY2026
$ 2,353 $ 2,262 $ 1,916 $ 1,979 $ 2,074 $ 2,166
163
227
214
223
229
233
117
131
136
143
150
111
157
149
76
76
78
80
$ 2,783 $ 2,757 $ 2,336 $ 2,414 $ 2,524 $ 2,629
1,668
363
1,663
392
1,014
270
$ 2,032 $ 2,055 $ 1,284
73.0%
55.0%
74.5%
253 $
9.1%
147
5.3%
499 $ 503 $ 384 S 396 S 410 $ 424
17.9% 18.2% 16.4% 16.4% 16.2% 16.1%
80
2.9%
537 $
19.3%
$ (511) $
(18.4%)
$207
(1) Assumes for modeling purposes that all exits occur January 1, 2024
29
81
435 S
15.8%
199 $ 668 $ 710 S 777 $ 841
7.2% 28.6%
29.4%
30.8%
32.0%
(346) $
(12.6%)
$110
nm
81
3.5%
1,033
276
$ 1,309 $ 1,337
54.2% 53.0%
175 $
7.5%
$125
nm
1,054
283
83
3.5%
9.4%
Am
$100
Fest
FY2027
86
3.4%
227 S 291
11.5%
412 $ 400 S 400 $ 400
16.6%
17.6%
15.8%
15.2%
1,071
293
$ 1,364
51.9%
$100
89
3.4%
352
13.4%
$100
* Net License Fee growth (FY 24 - FY'27) of -4.0% per annum., assuming 2.5% ARPM growth and slight
membership growth
+ Access Revenues growing at -4.3% through 2025 and then holding membership flat thereafter
Marginal increase in penetration rates from Ancillary revenues
•
• Calculated at a building level - includes rent savings from renegotiated leases
• Calculated either based upon number of remaining locations or as a % of revenues
▪
·
Plan assumes no new locations.
·
Dependent upon individual market participation; currently, the Plan assumes no exits from
markets
• Target SG&A reductions to steady state of 400 million
any
individual
Capex of approximately $25 million per quarter with additional amounts in 2024 due to deferred capex spend
11View entire presentation