Tudor, Pickering, Holt & Co Investment Banking
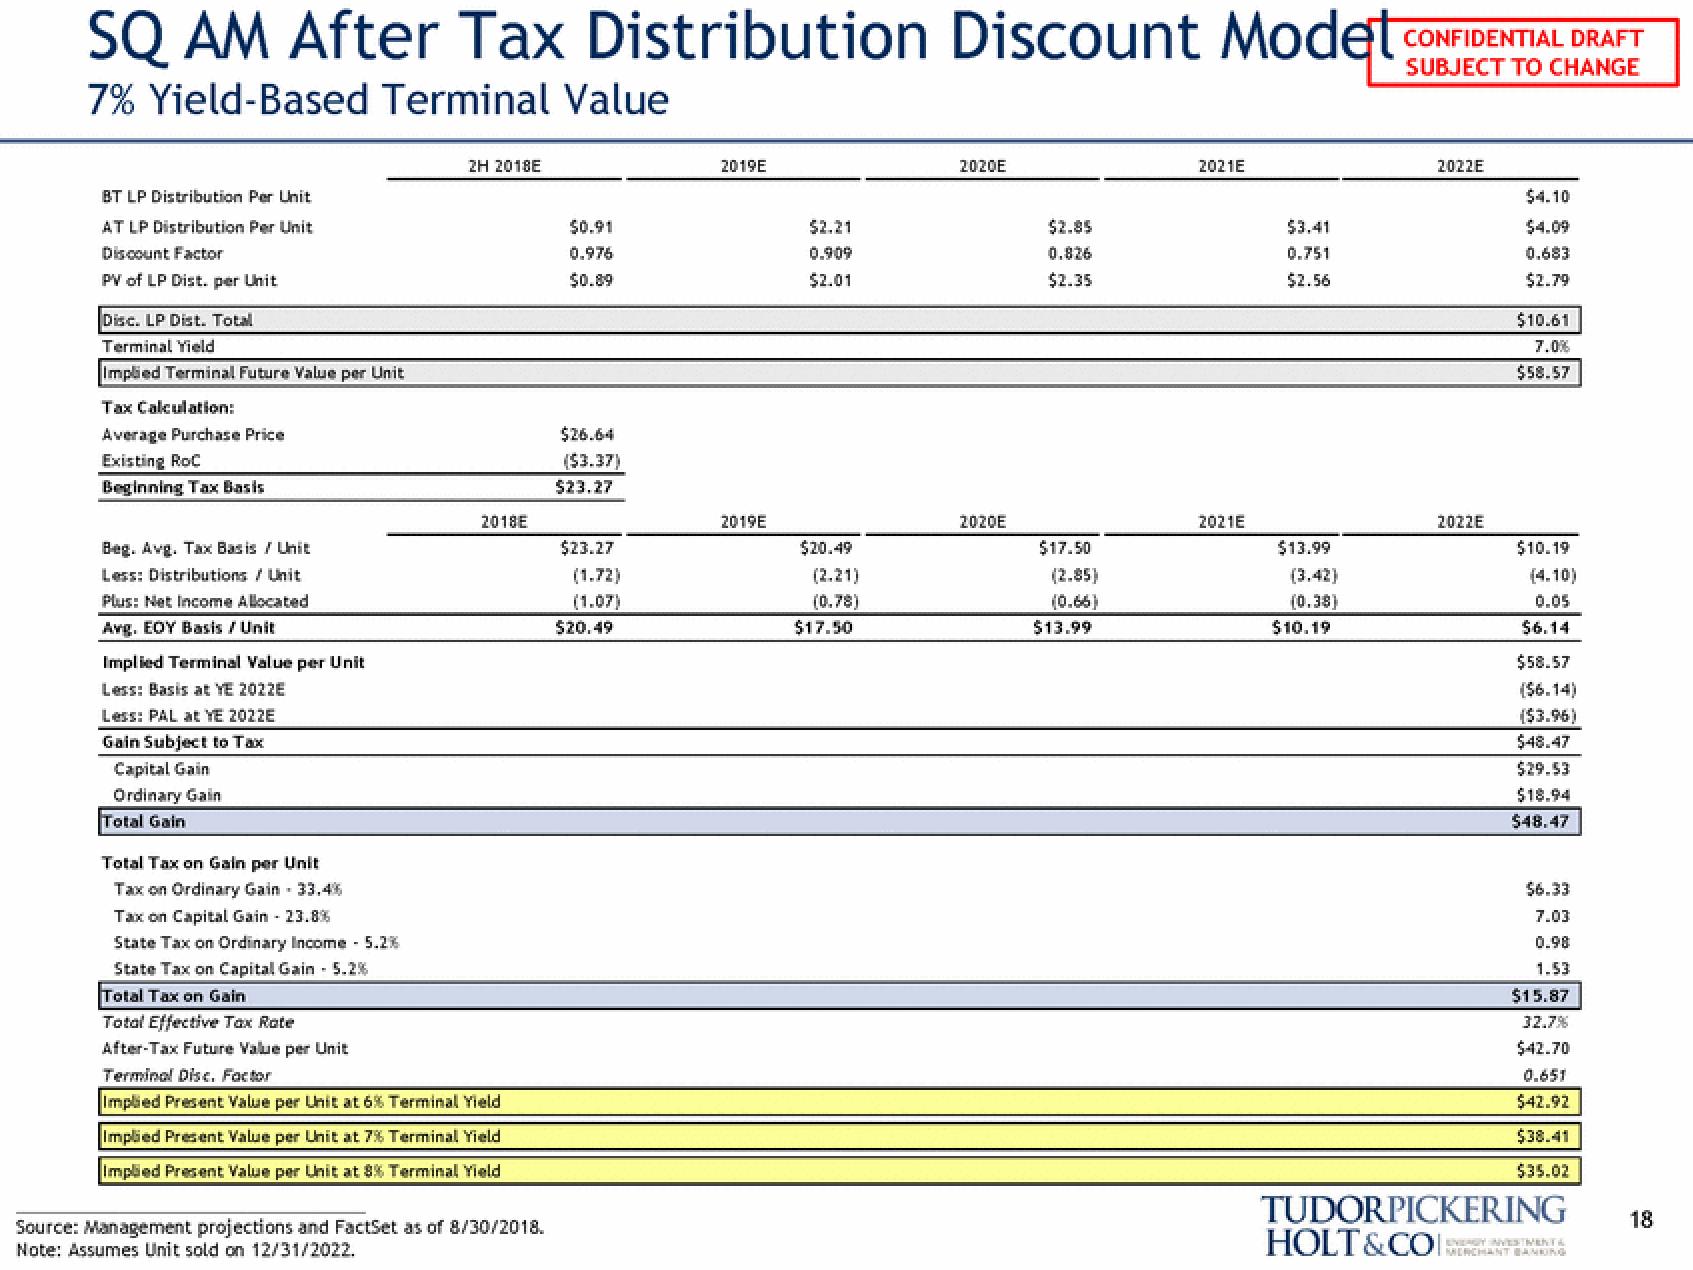
SQ AM After Tax Distribution Discount Modet
7% Yield-Based Terminal Value
BT LP Distribution Per Unit
AT LP Distribution Per Unit
Discount Factor
PV of LP Dist. per Unit
Disc. LP Dist. Total
Terminal Yield
Implied Terminal Future Value per Unit
Tax Calculation:
Average Purchase Price
Existing RoC
Beginning Tax Basis
Beg. Avg. Tax Basis / Unit
Less: Distributions / Unit
Plus: Net Income Allocated
Avg. EOY Basis / Unit
Implied Terminal Value per Unit
Less: Basis at YE 2022E
Less: PAL at YE 2022E
Gain Subject to Tax
Capital Gain
Ordinary Gain
Total Gain
Total Tax on Gain per Unit
Tax on Ordinary Gain - 33.4%
Tax on Capital Gain - 23.8%
State Tax on Ordinary Income - 5.2%
State Tax on Capital Gain 5.2%
Total Tax on Gain
Total Effective Tax Rate
2H 2018E
2018E
After-Tax Future Value per Unit
Terminal Dise, Factor
Implied Present Value per Unit at 6% Terminal Yield
Implied Present Value per Unit at 7% Terminal Yield
Implied Present Value per Unit at 8% Terminal Yield
Source: Management projections and FactSet as of 8/30/2018.
Note: Assumes Unit sold on 12/31/2022.
$0.91
0.976
$0.89
$26.64
($3.37)
$23.27
$23.27
(1.72)
(1.07)
$20.49
2019E
2019E
$2.21
0.909
$2.01
$20.49
(2.21)
(0.78)
$17.50
2020E
2020E
$2.85
0.826
$2.35
$17.50
(2.85)
(0.66)
$13.99
2021E
2021E
$3.41
0.751
$2.56
$13.99
(0.38)
$10.19
CONFIDENTIAL DRAFT
SUBJECT TO CHANGE
2022E
2022E
$4.10
0.683
$2.79
$10.61
7.0%
$58.57
$10.19
(4.10)
0.05
$6.14
$58.57
($6.14)
($3.96)
$48.47
$29.53
$18.94
$48.47
$6.33
7.03
0.98
1.53
$15.87
32.7%
$42.70
0.651
$42.92
$38.41
$35.02
TUDORPICKERING 18
HOLT&COCHANT BANKINGView entire presentation