Dutch Bros Investor Presentation Deck
SAME SHOP SALES
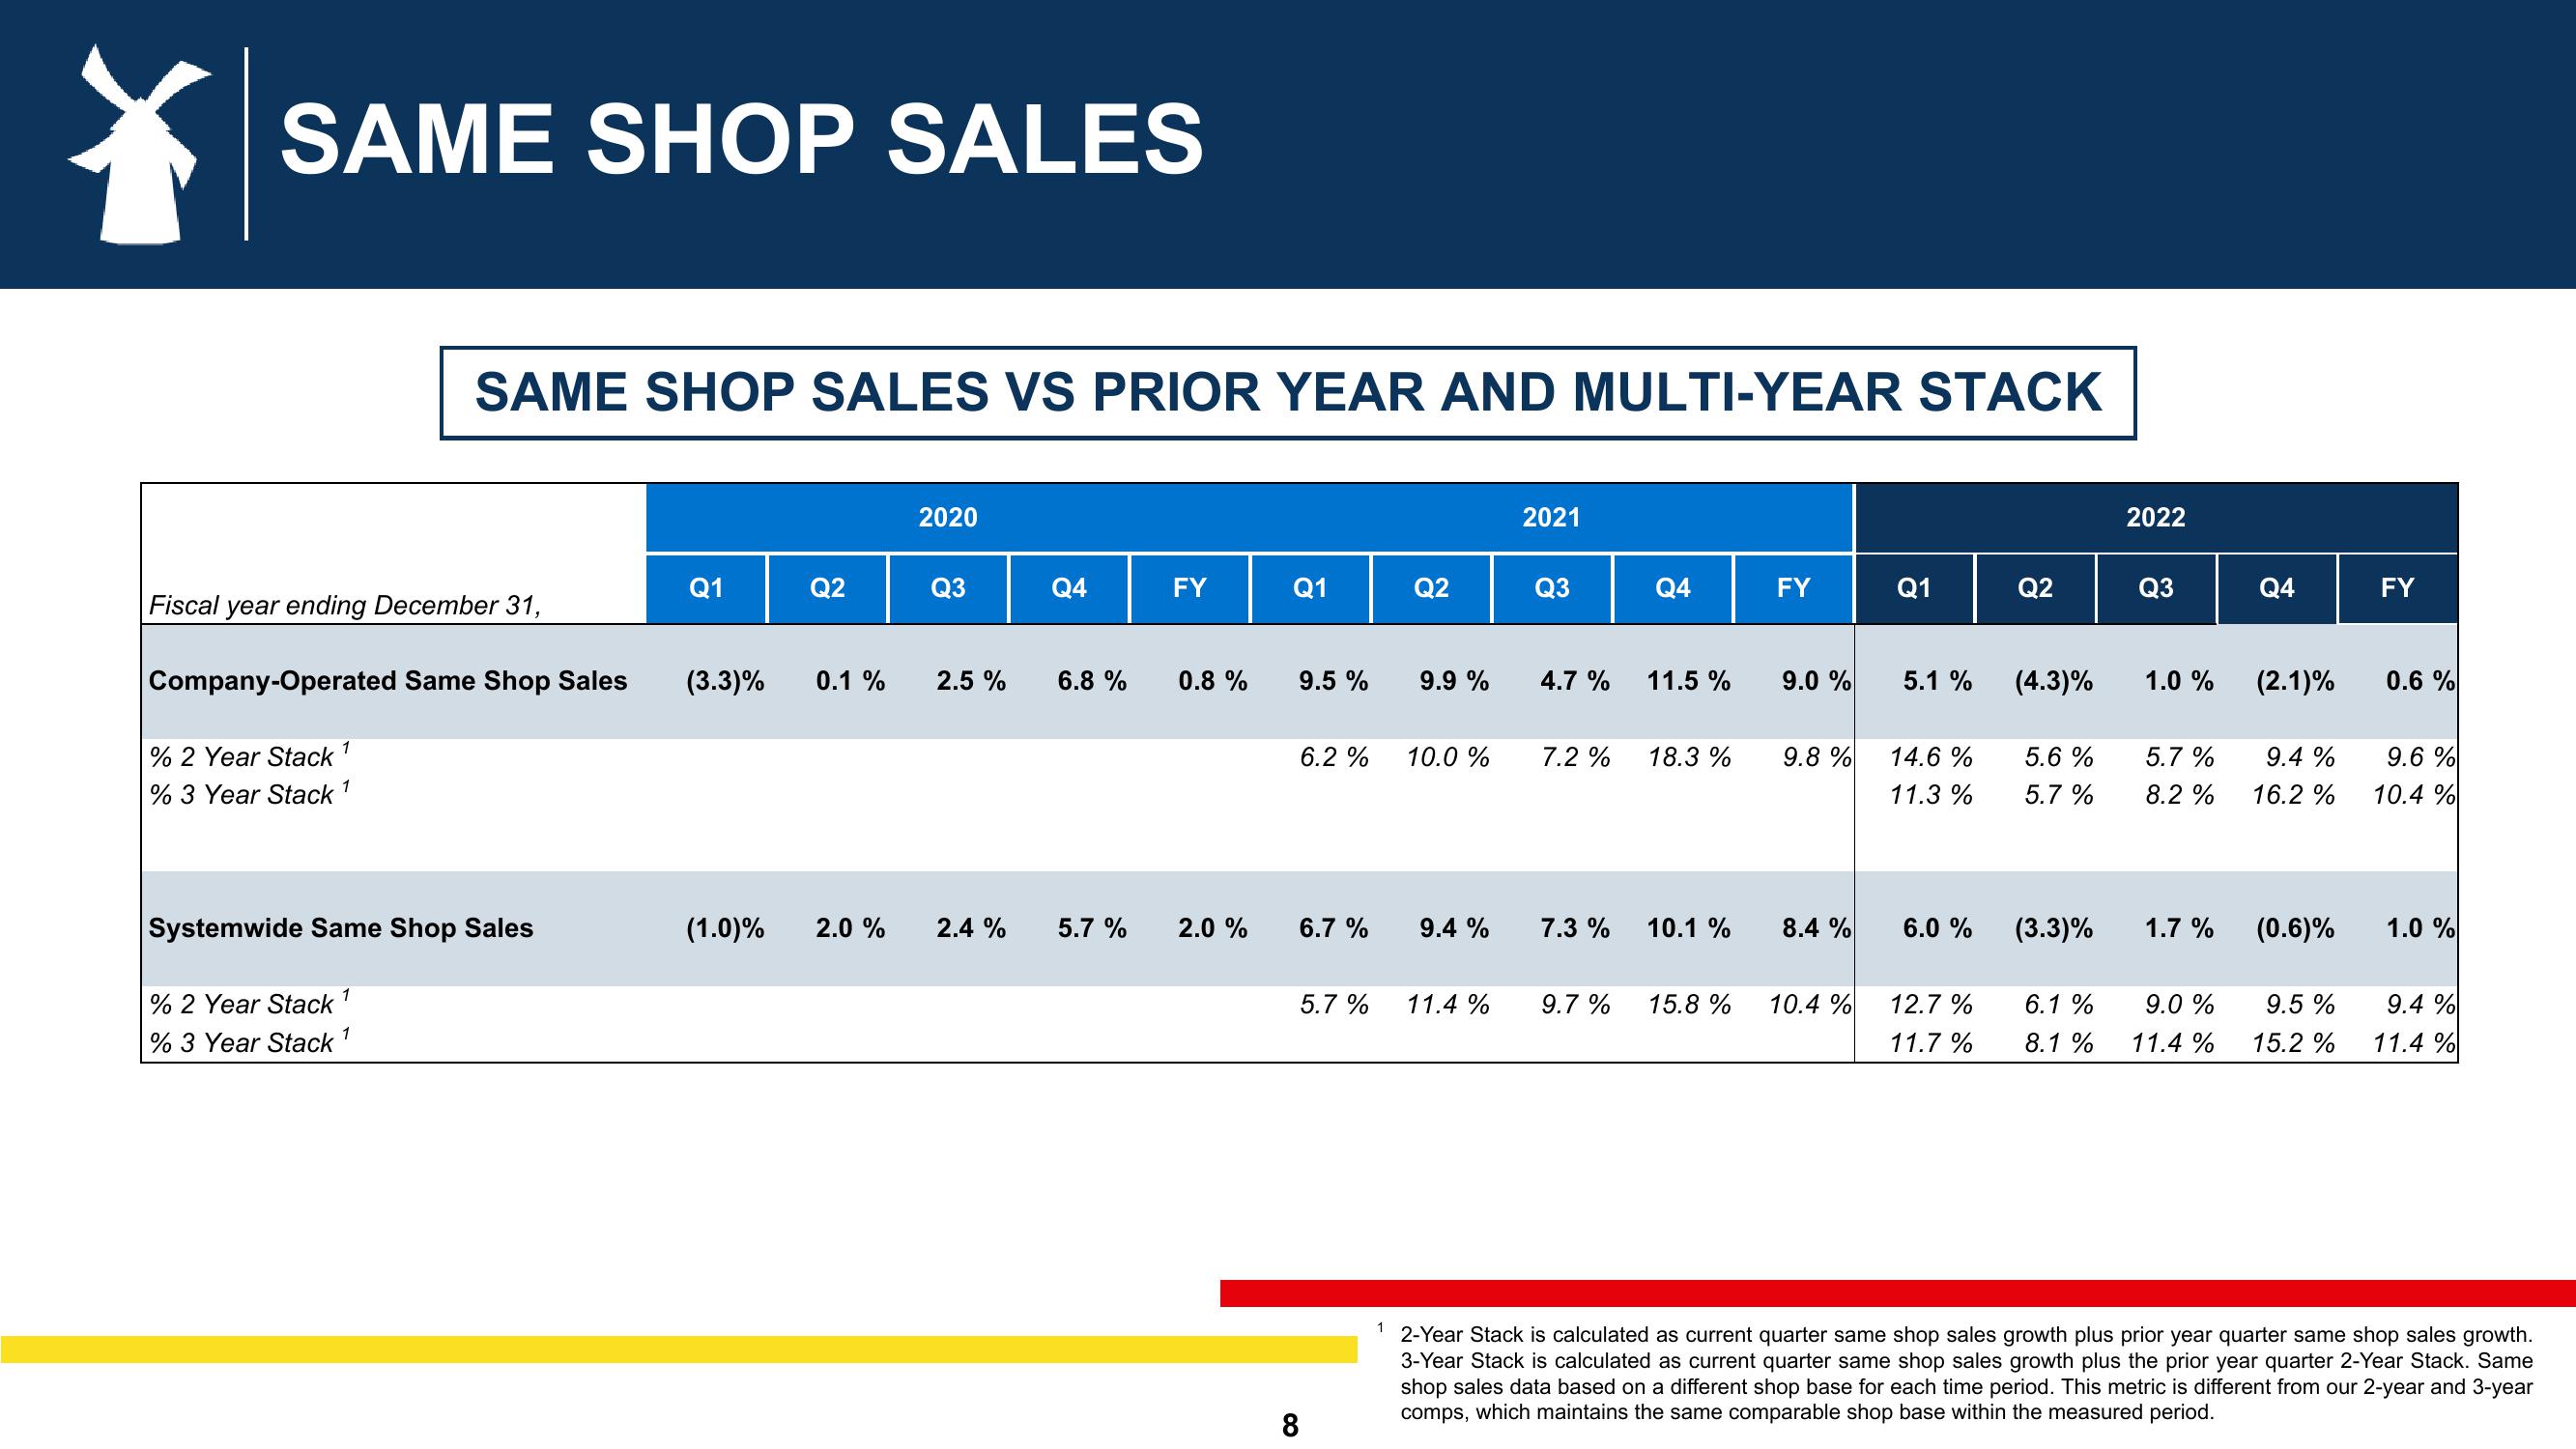
SAME SHOP SALES VS PRIOR YEAR AND MULTI-YEAR STACK
Fiscal year ending December 31,
Company-Operated Same Shop Sales
% 2 Year Stack
1
% 3 Year Stack 1
Systemwide Same Shop Sales
% 2 Year Stack ¹
% 3 Year Stack ¹
Q1
(3.3)%
(1.0)%
Q2
0.1 %
2.0 %
2020
Q3
2.5%
2.4 %
Q4
6.8 %
5.7 %
FY
0.8 %
2.0 %
Q1
9.5 %
6.2 %
6.7 %
5.7 %
8
Q2
9.9 %
10.0 %
9.4 %
11.4 %
2021
Q3
4.7 % 11.5%
7.2%
7.3 %
Q4
9.7 %
18.3%
10.1 %
15.8%
FY
9.0 %
9.8 %
8.4 %
10.4 %
Q1
5.1 %
14.6%
11.3%
6.0 %
12.7 %
11.7%
Q2
(4.3)%
5.6 %
5.7 %
(3.3)%
6.1 %
8.1 %
2022
Q3
1.0 %
5.7 %
8.2 %
1.7 %
9.0 %
11.4%
Q4
(2.1)%
9.4 %
16.2 %
(0.6)%
9.5 %
15.2 %
FY
0.6 %
9.6 %
10.4 %
1.0 %
9.4 %
11.4%
1 2-Year Stack is calculated as current quarter same shop sales growth plus prior year quarter same shop sales growth.
3-Year Stack is calculated as current quarter same shop sales growth plus the prior year quarter 2-Year Stack. Same
shop sales data based on a different shop base for each time period. This metric is different from our 2-year and 3-year
comps, which maintains the same comparable shop base within the measured period.View entire presentation