Wix Results Presentation Deck
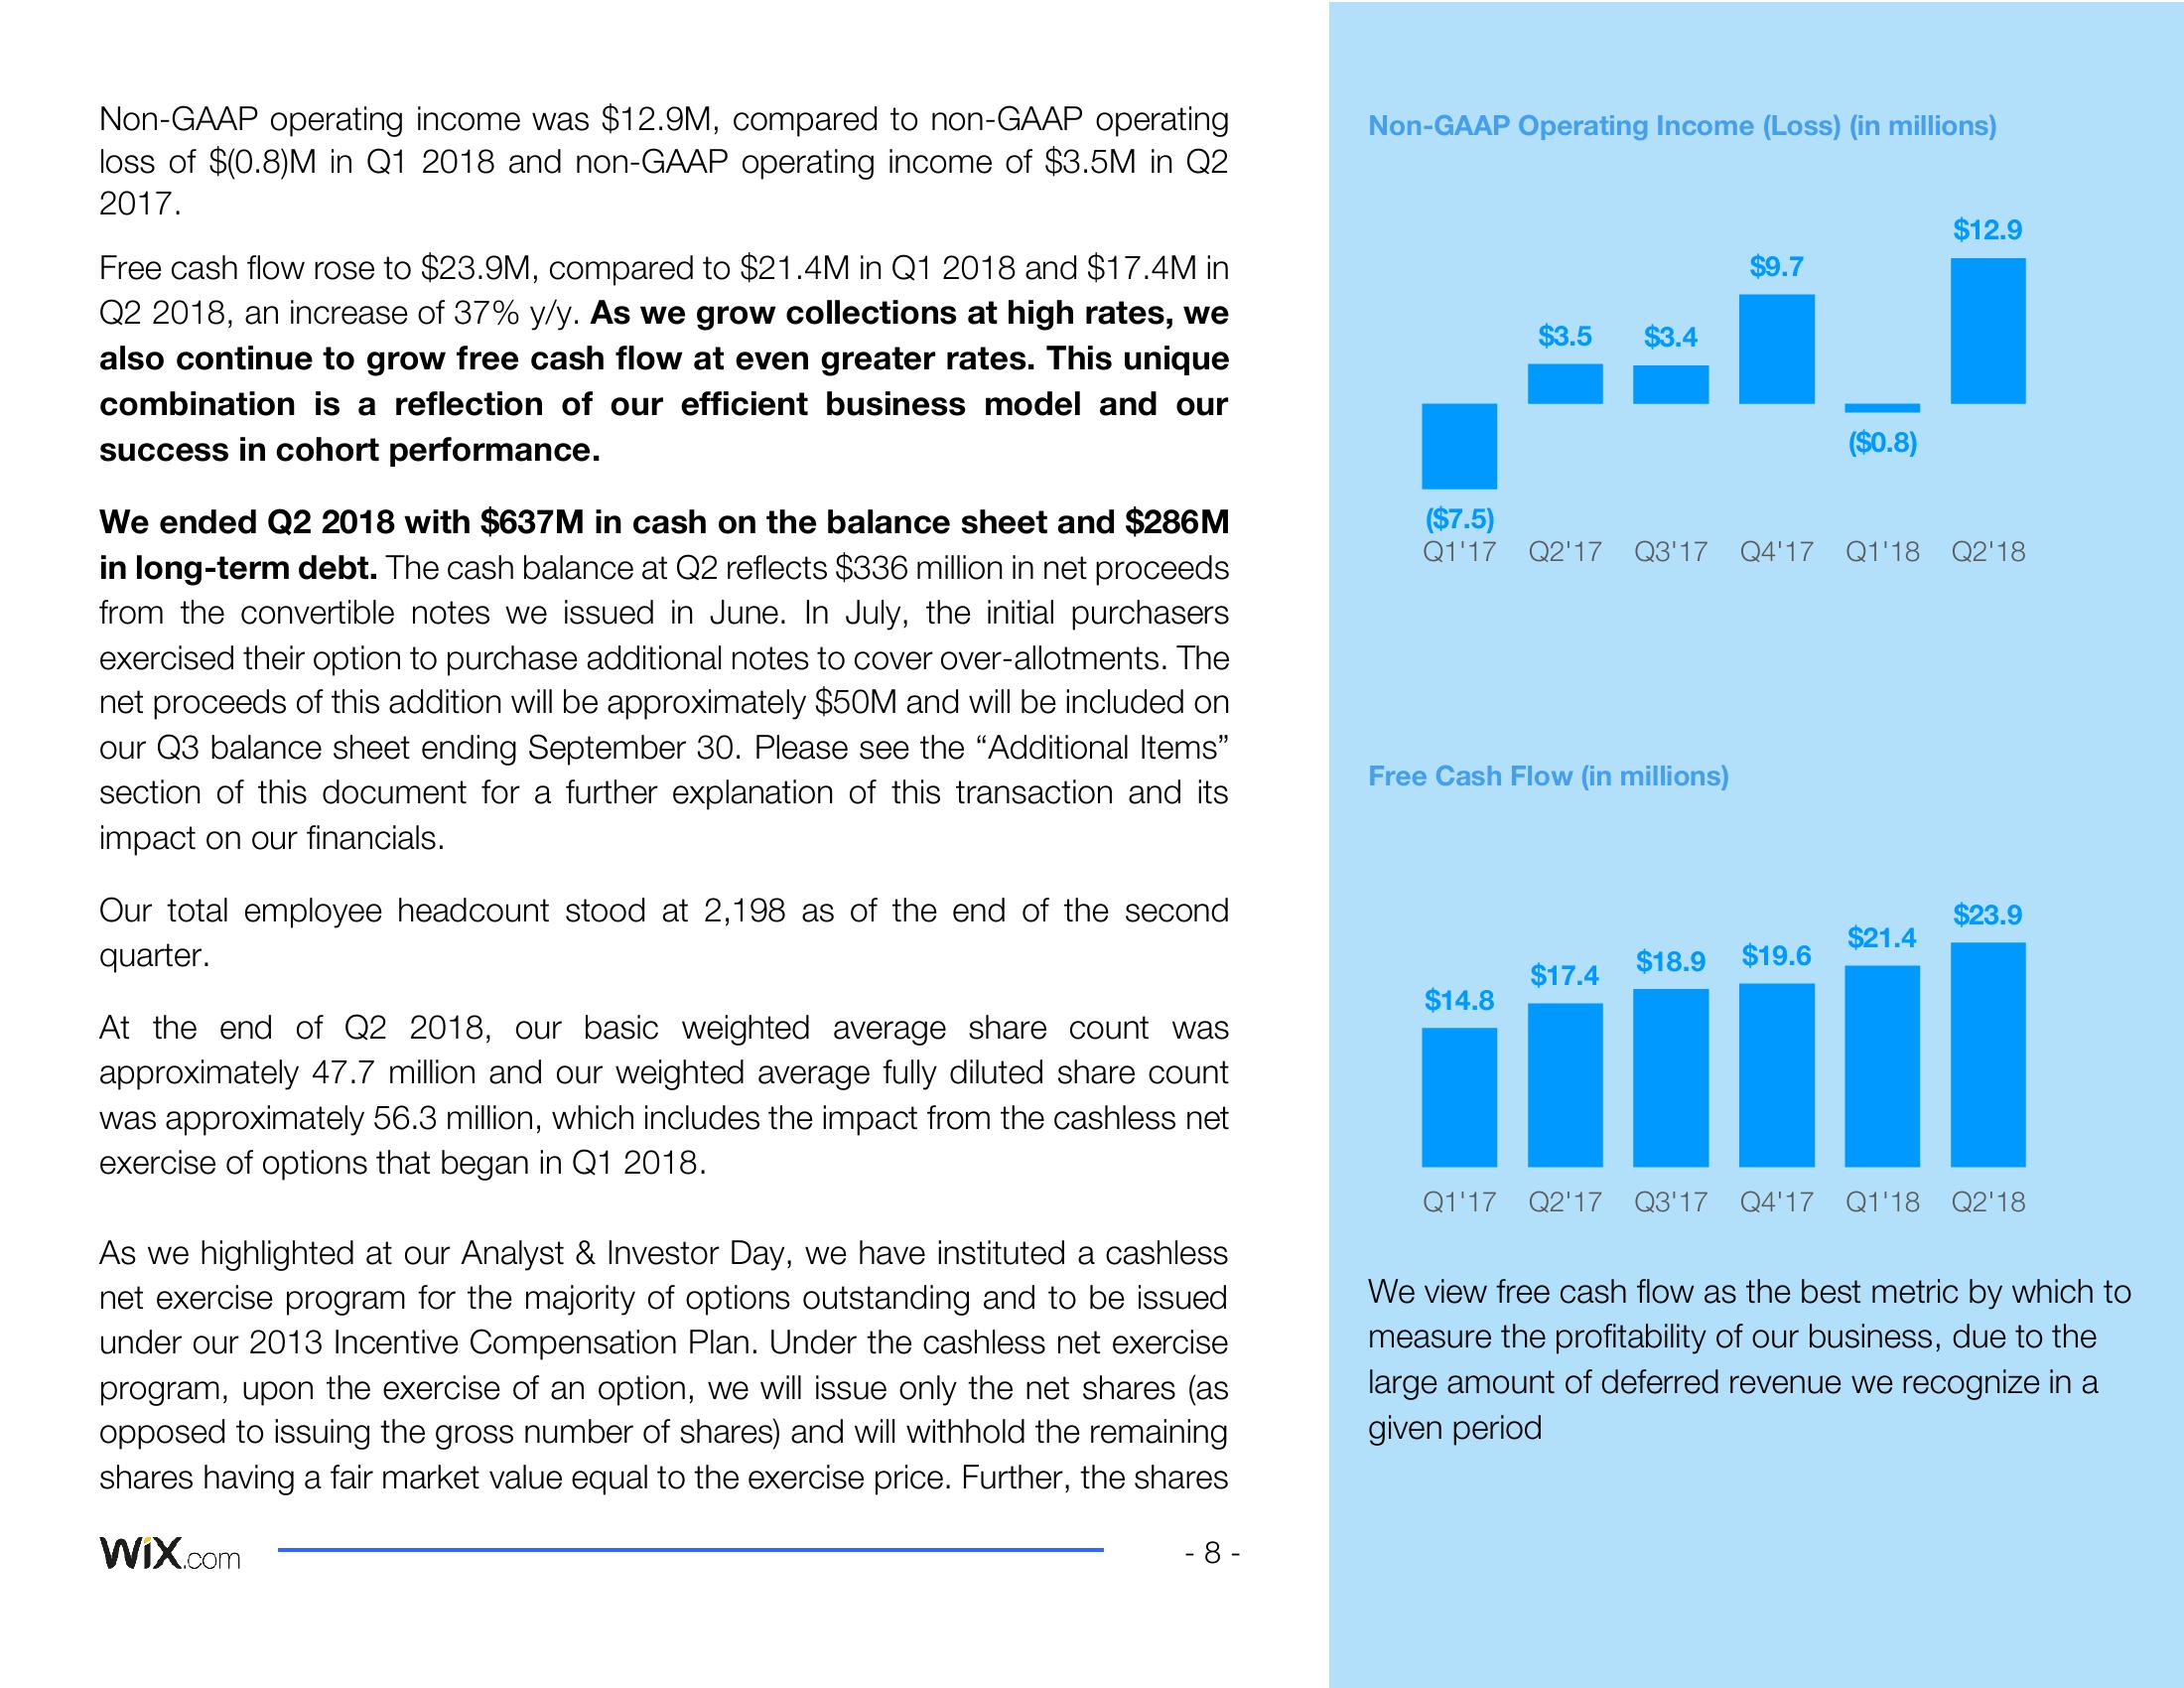
Non-GAAP operating income was $12.9M, compared to non-GAAP operating
loss of $(0.8)M in Q1 2018 and non-GAAP operating income of $3.5M in Q2
2017.
Free cash flow rose to $23.9M, compared to $21.4M in Q1 2018 and $17.4M in
Q2 2018, an increase of 37% y/y. As we grow collections at high rates, we
also continue to grow free cash flow at even greater rates. This unique
combination is a reflection of our efficient business model and our
success in cohort performance.
We ended Q2 2018 with $637M in cash on the balance sheet and $286M
in long-term debt. The cash balance at Q2 reflects $336 million in net proceeds
from the convertible notes we issued in June. In July, the initial purchasers
exercised their option to purchase additional notes to cover over-allotments. The
net proceeds of this addition will be approximately $50M and will be included on
our Q3 balance sheet ending September 30. Please see the "Additional Items"
section of this document for a further explanation of this transaction and its
impact on our financials.
Our total employee headcount stood at 2,198 as of the end of the second
quarter.
At the end of Q2 2018, our basic weighted average share count was
approximately 47.7 million and our weighted average fully diluted share count
was approximately 56.3 million, which includes the impact from the cashless net
exercise of options that began in Q1 2018.
As we highlighted at our Analyst & Investor Day, we have instituted a cashless
net exercise program for the majority of options outstanding and to be issued
under our 2013 Incentive Compensation Plan. Under the cashless net exercise
program, upon the exercise of an option, we will issue only the net shares (as
opposed to issuing the gross number of shares) and will withhold the remaining
shares having a fair market value equal to the exercise price. Further, the shares
WIX.com
-8-
Non-GAAP Operating Income (Loss) (in millions)
$3.5 $3.4
Free Cash Flow (in millions)
$14.8
$9.7
($7.5)
Q1'17 Q2'17 Q3'17 Q4'17 Q1'18 Q2'18
$17.4
($0.8)
$18.9 $19.6
$12.9
$21.4
$23.9
Q1'17 Q2'17 Q3'17 Q4'17 Q1'18 Q2'18
We view free cash flow as the best metric by which to
measure the profitability of our business, due to the
large amount of deferred revenue we recognize in a
given periodView entire presentation