Babylon SPAC Presentation Deck
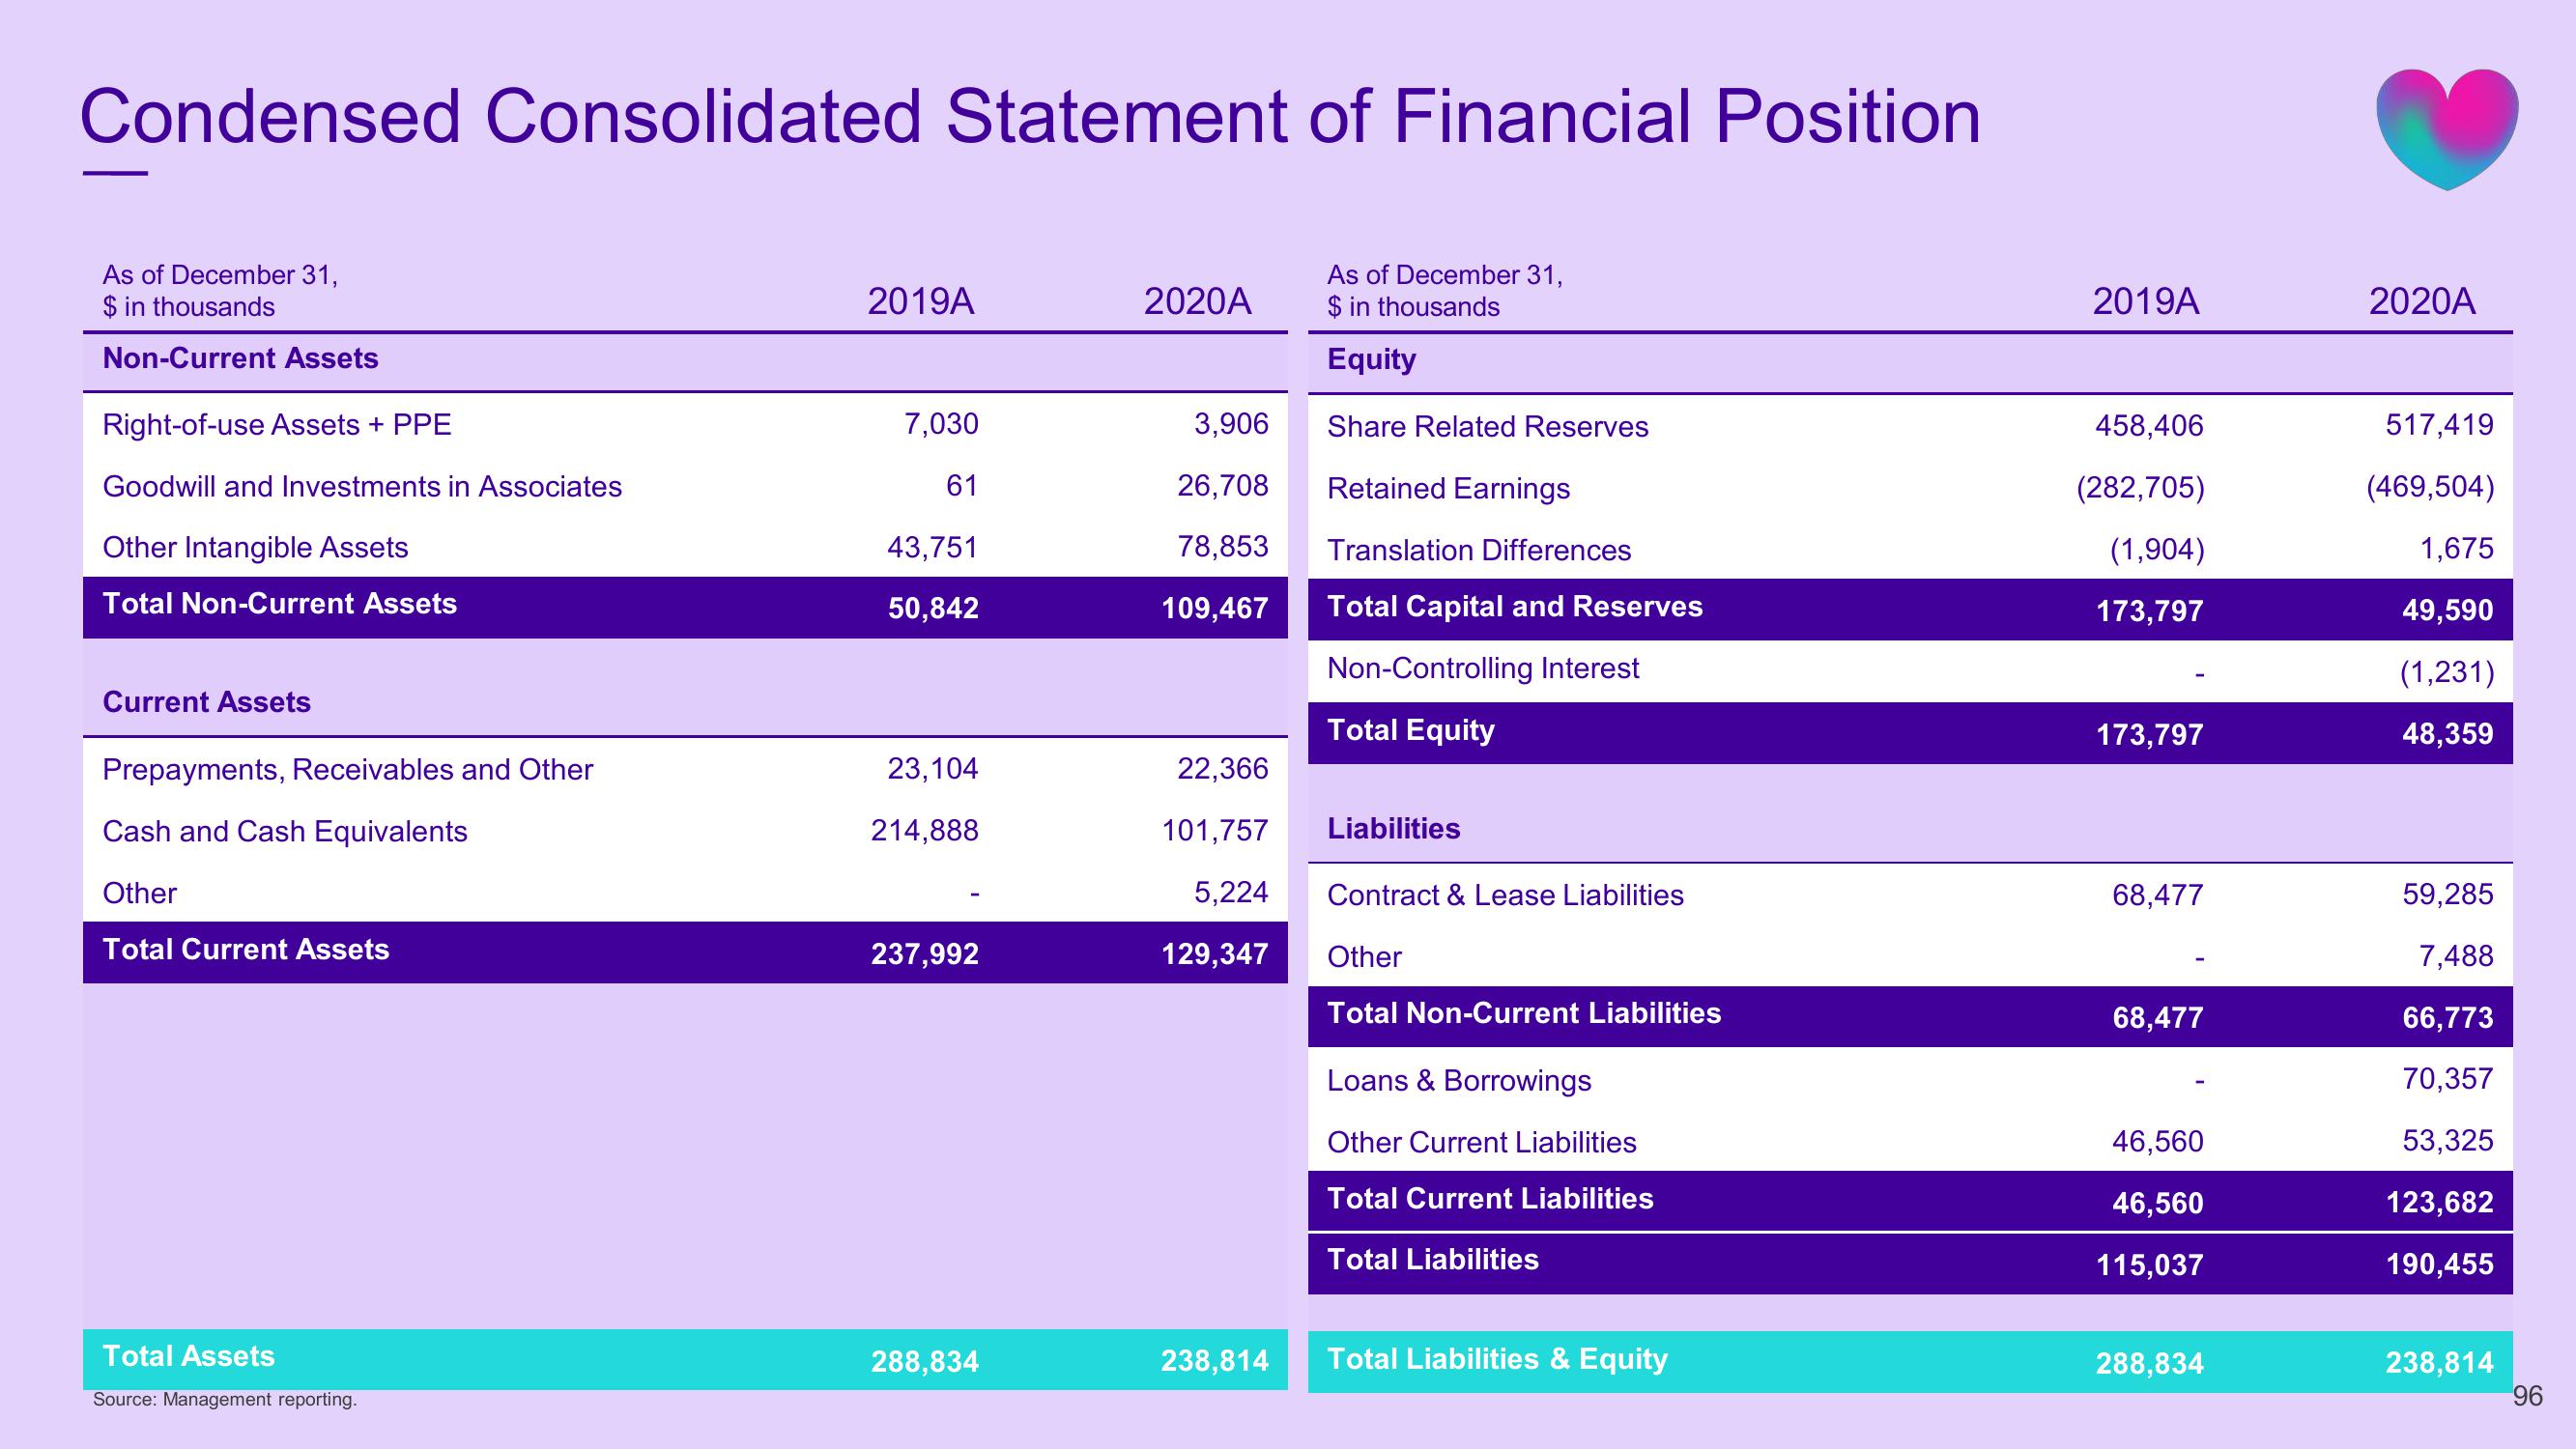
Condensed Consolidated Statement of Financial Position
As of December 31,
$ in thousands
Non-Current Assets
Right-of-use Assets + PPE
Goodwill and Investments in Associates
Other Intangible Assets
Total Non-Current Assets
Current Assets
Prepayments, Receivables and Other
Cash and Cash Equivalents
Other
Total Current Assets
Total Assets
Source: Management reporting.
2019A
7,030
61
43,751
50,842
23,104
214,888
237,992
288,834
2020A
3,906
26,708
78,853
109,467
22,366
101,757
5,224
129,347
238,814
As of December 31,
$ in thousands
Equity
Share Related Reserves
Retained Earnings
Translation Differences
Total Capital and Reserves
Non-Controlling Interest
Total Equity
Liabilities
Contract & Lease Liabilities
Other
Total Non-Current Liabilities
Loans & Borrowings
Other Current Liabilities
Total Current Liabilities
Total Liabilities
Total Liabilities & Equity
2019A
458,406
(282,705)
(1,904)
173,797
173,797
68,477
68,477
46,560
46,560
115,037
288,834
2020A
517,419
(469,504)
1,675
49,590
(1,231)
48,359
59,285
7,488
66,773
70,357
53,325
123,682
190,455
238,814
96View entire presentation