Zegna Results Presentation Deck
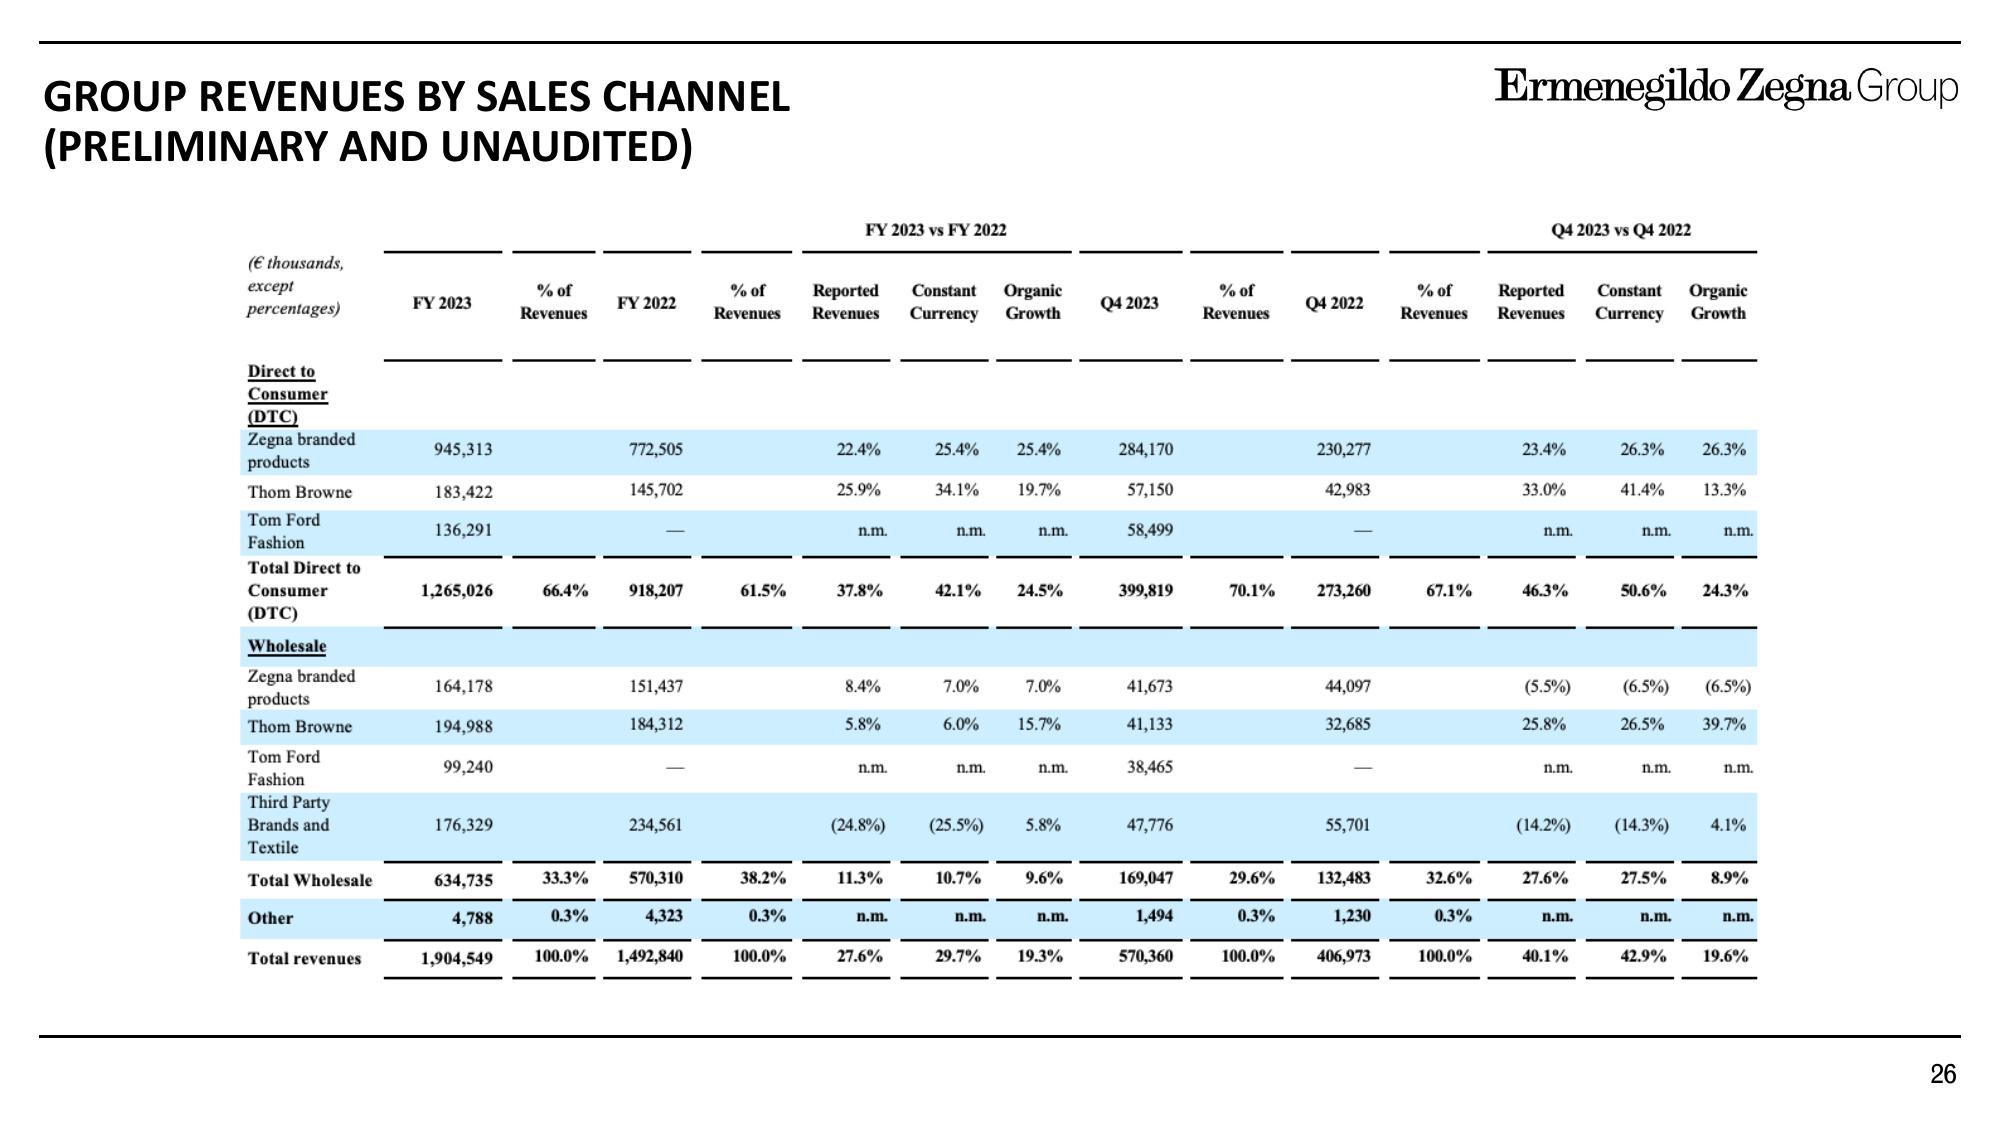
GROUP REVENUES BY SALES CHANNEL
(PRELIMINARY AND UNAUDITED)
(€ thousands,
except
percentages)
Direct to
Consumer
(DTC)
Zegna branded
products
Thom Browne
Tom Ford
Fashion
Total Direct to
Consumer
(DTC)
Wholesale
Zegna branded
products
Thom Browne
Tom Ford
Fashion
Third Party
Brands and
Textile
Total Wholesale
Other
Total revenues
FY 2023
945,313
183,422
136,291
1,265,026
164,178
194,988
99,240
176,329
634,735
4,788
1,904,549
% of
Revenues
66.4%
33.3%
0.3%
FY 2022
772,505
145,702
918,207
151,437
184,312
234,561
15
570,310
4,323
100.0% 1,492,840
% of
Revenues
61.5%
38.2%
0.3%
100.0%
FY 2023 vs FY 2022
Reported Constant Organic
Revenues Currency Growth
22.4%
25.9%
n.m.
37.8%
8.4%
5.8%
n.m.
(24.8%)
11.3%
n.m.
27.6%
25.4% 25.4%
34.1%
n.m.
42.1%
7.0%
6.0%
n.m.
(25.5%)
10.7%
n.m.
29.7%
19.7%
n.m.
24.5%
7.0%
15.7%
n.m.
5.8%
9.6%
n.m.
19.3%
Q4 2023
284,170
57,150
58,499
399,819
41,673
41,133
38,465
47,776
169,047
1,494
570,360
% of
Revenues
70.1%
29.6%
0.3%
100.0%
Q4 2022
230,277
42,983
273,260
44,097
32,685
55,701
132,483
1,230
406,973
% of
Revenues
67.1%
32.6%
0.3%
100.0%
Ermenegildo Zegna Group
Q4 2023 vs Q4 2022
Reported
Revenues
23.4%
33.0%
n.m.
46.3%
(5.5%)
25.8%
n.m.
(14.2%)
27.6%
n.m.
40.1%
Constant Organic
Currency Growth
26.3% 26.3%
41.4%
n.m.
50.6%
(6.5%)
26.5%
n.m.
(14.3%)
27.5%
n.m.
42.9%
13.3%
n.m.
24.3%
(6.5%)
39.7%
n.m.
4.1%
8.9%
n.m.
19.6%
26View entire presentation