Samsara Investor Day Presentation Deck
70
Ⓒ Samsara Inc.
samsara
GAAP operating loss
GAAP operating margin
Add: Stock-based compensation
expense-related charges
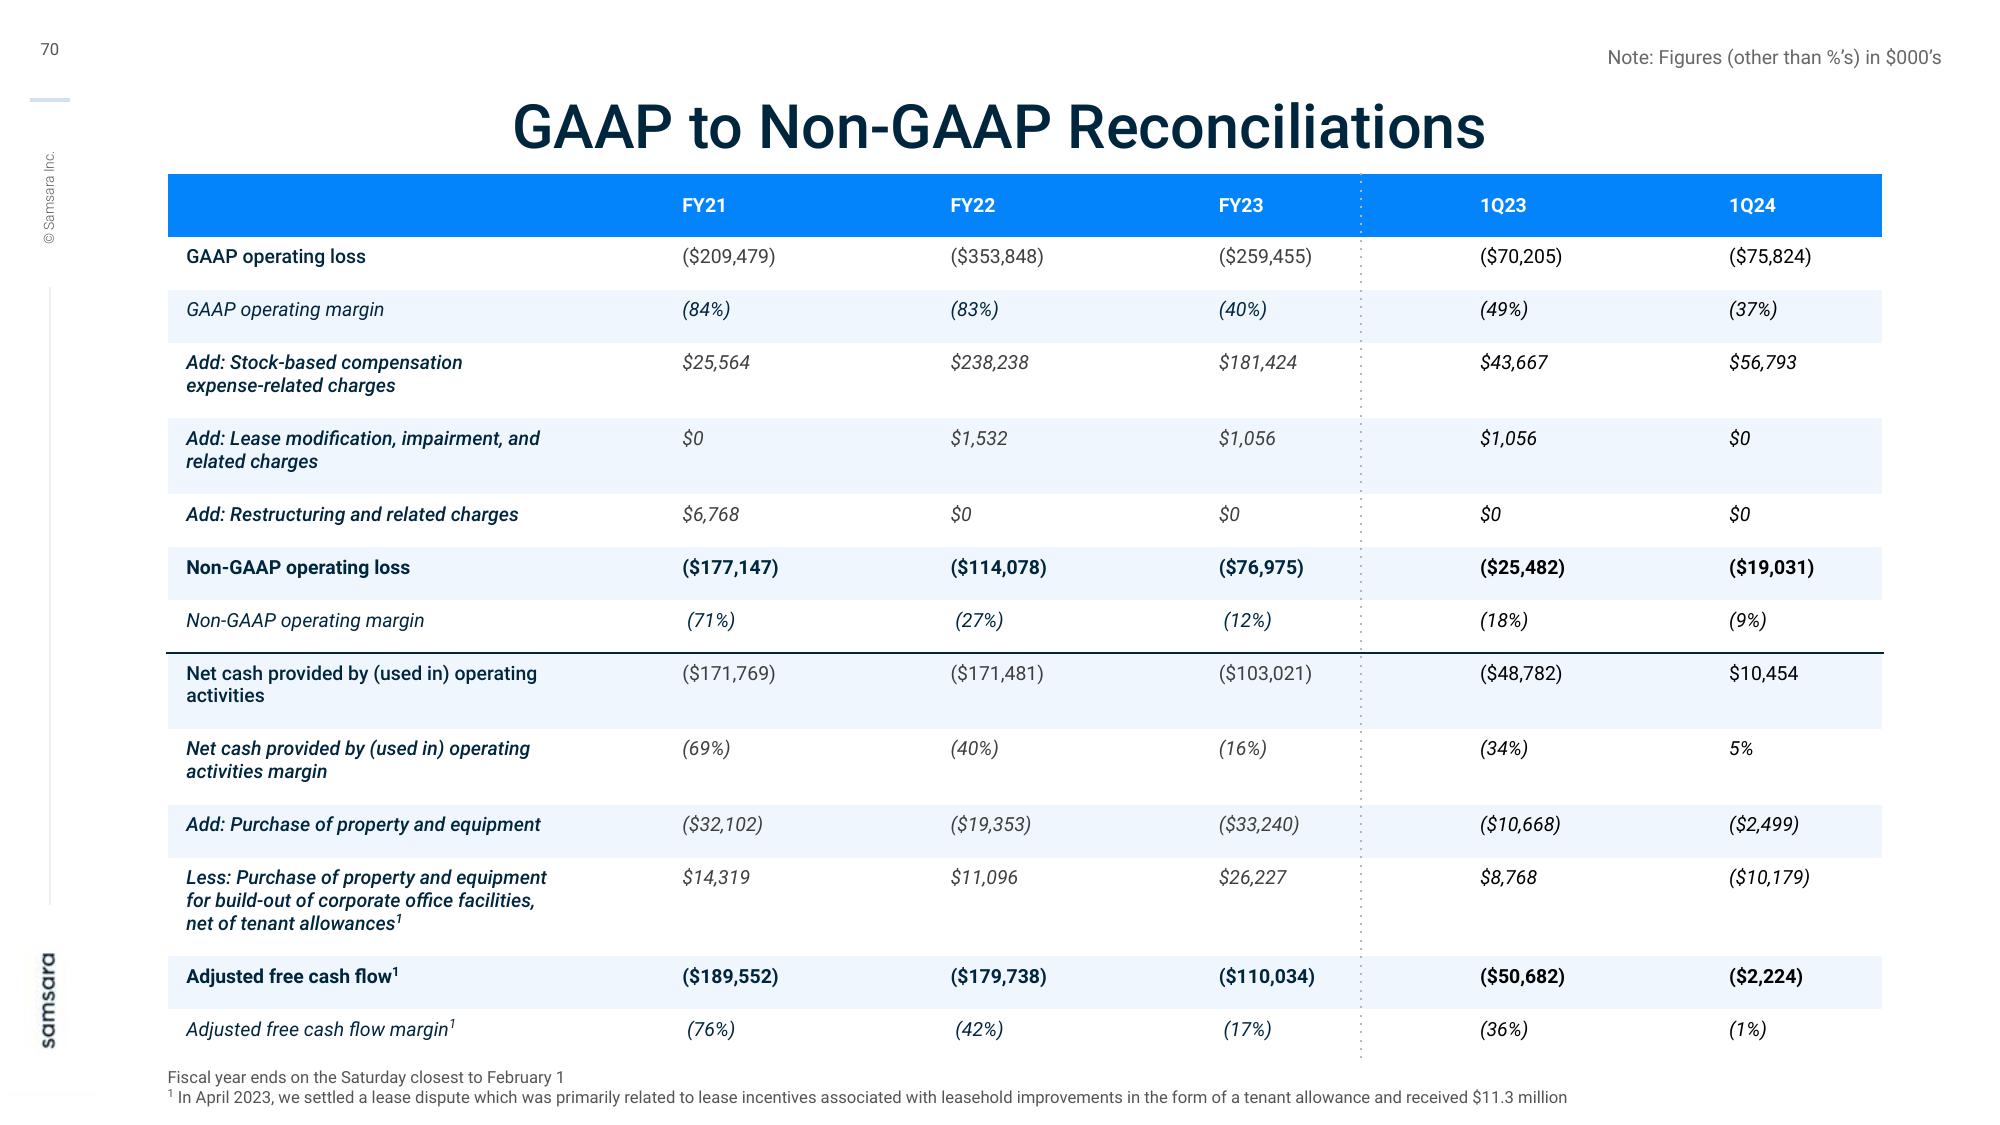
GAAP to Non-GAAP Reconciliations
Add: Lease modification, impairment, and
related charg
Add: Restructuring and related charges
Non-GAAP operating loss
Non-GAAP operating margin
Net cash provided by (used in) operating
activities
Net cash provided by (used in) operating
activities margin
Add: Purchase of property and equipment
Less: Purchase of property and equipment
for build-out of corporate office facilities,
net of tenant allowances¹
FY21
($209,479)
(84%)
$25,564
$0
$6,768
($177,147)
(71%)
($171,769)
(69%)
($32,102)
$14,319
($189,552)
FY22
(76%)
($353,848)
(83%)
$238,238
$1,532
$0
($114,078)
(27%)
($171,481)
(40%)
($19,353)
$11,096
($179,738)
FY23
(42%)
($259,455)
(40%)
$181,424
$1,056
$0
($76,975)
(12%)
($103,021)
(16%)
($33,240)
$26,227
1Q23
($110,034)
(17%)
($70,205)
(49%)
$43,667
$1,056
$0
($25,482)
(18%)
Adjusted free cash flow¹
Adjusted free cash flow margin¹
Fiscal year ends on the Saturday closest to February 1
1 In April 2023, we settled a lease dispute which was primarily related to lease incentives associated with leasehold improvements in the form of a tenant allowance and received $11.3 million
($48,782)
(34%)
($10,668)
$8,768
($50,682)
(36%)
Note: Figures (other than %'s) in $000's
1024
($75,824)
(37%)
$56,793
$0
$0
($19,031)
(9%)
$10,454
5%
($2,499)
($10,179)
($2,224)
(1%)View entire presentation