Rally SPAC Presentation Deck
Assumptions: Events offering
Events build brand through association, changing the perception of buses
ASSUMPTIONS COMMENTARY¹
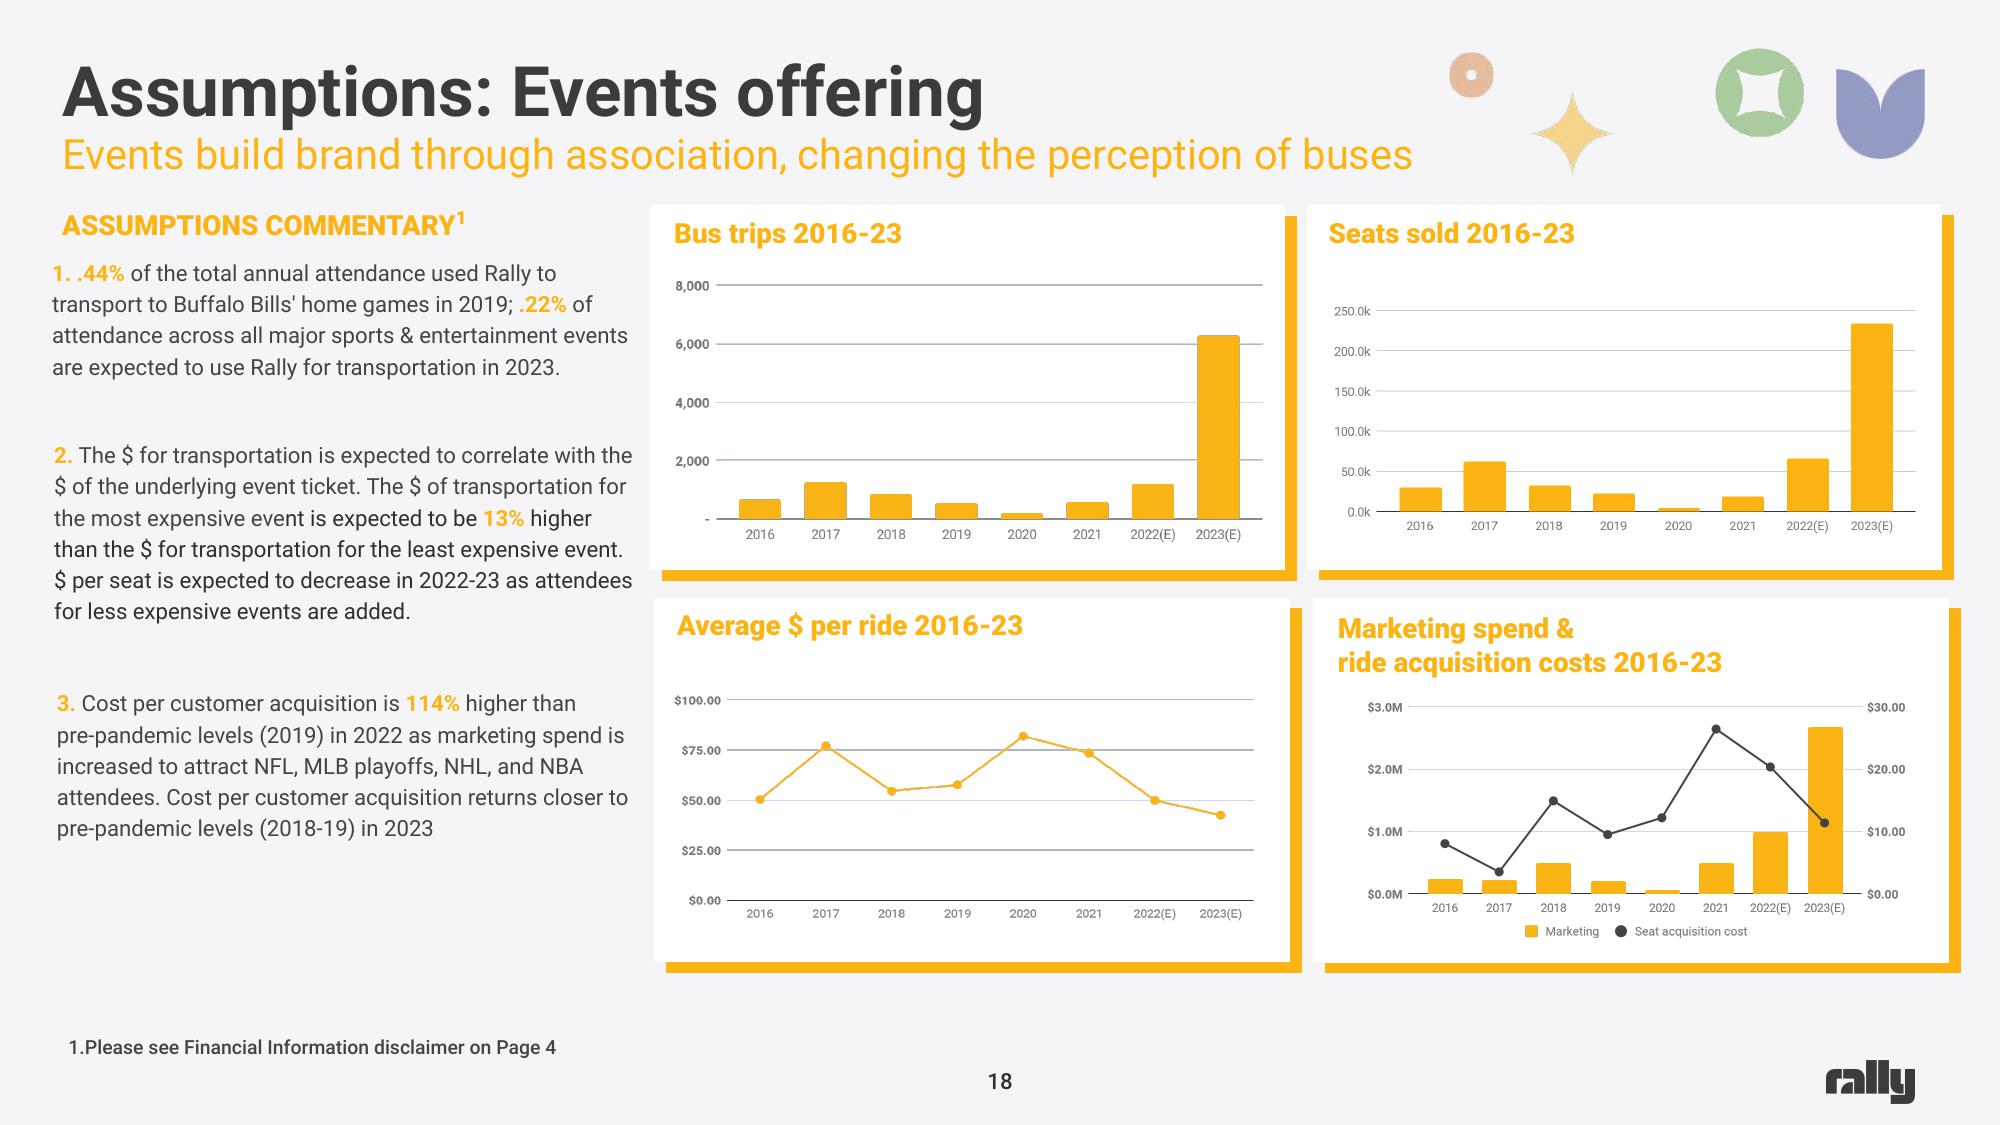
1..44% of the total annual attendance used Rally to
transport to Buffalo Bills' home games in 2019; .22% of
attendance across all major sports & entertainment events
are expected to use Rally for transportation in 2023.
2. The $ for transportation is expected to correlate with the
$ of the underlying event ticket. The $ of transportation for
the most expensive event is expected to be 13% higher
than the $ for transportation for the least expensive event.
$ per seat is expected to decrease in 2022-23 as attendees
for less expensive events are added.
3. Cost per customer acquisition is 114% higher than
pre-pandemic levels (2019) in 2022 as marketing spend is
increased to attract NFL, MLB playoffs, NHL, and NBA
attendees. Cost per customer acquisition returns closer to
pre-pandemic levels (2018-19) in 2023
1.Please see Financial Information disclaimer on Page 4
Bus trips 2016-23
8,000
6,000
4,000
2,000
$100.00
$75.00
$50.00
$25.00
2016
Average $ per ride 2016-23
$0.00
2017
2016
2018
2017
2019
2018
2020
2019
2020
18
2021 2022(E) 2023(E)
2021 2022(E) 2023(E)
Seats sold 2016-23
250.0k
200.0k
150.0k
100.0k
50.0k
0.0k
$3.0M
$2.0M
$1.0M
2016
$0.0M
Marketing spend &
ride acquisition costs 2016-23
2017
2016
2018
2017
2019
2020
2018 2019
Marketing
2020
2021
2021 2022(E) 2023(E)
Seat acquisition cost
2022(E) 2023(E)
$30.00
$20.00
$10.00
$0.00
rallyView entire presentation