zSpace SPAC
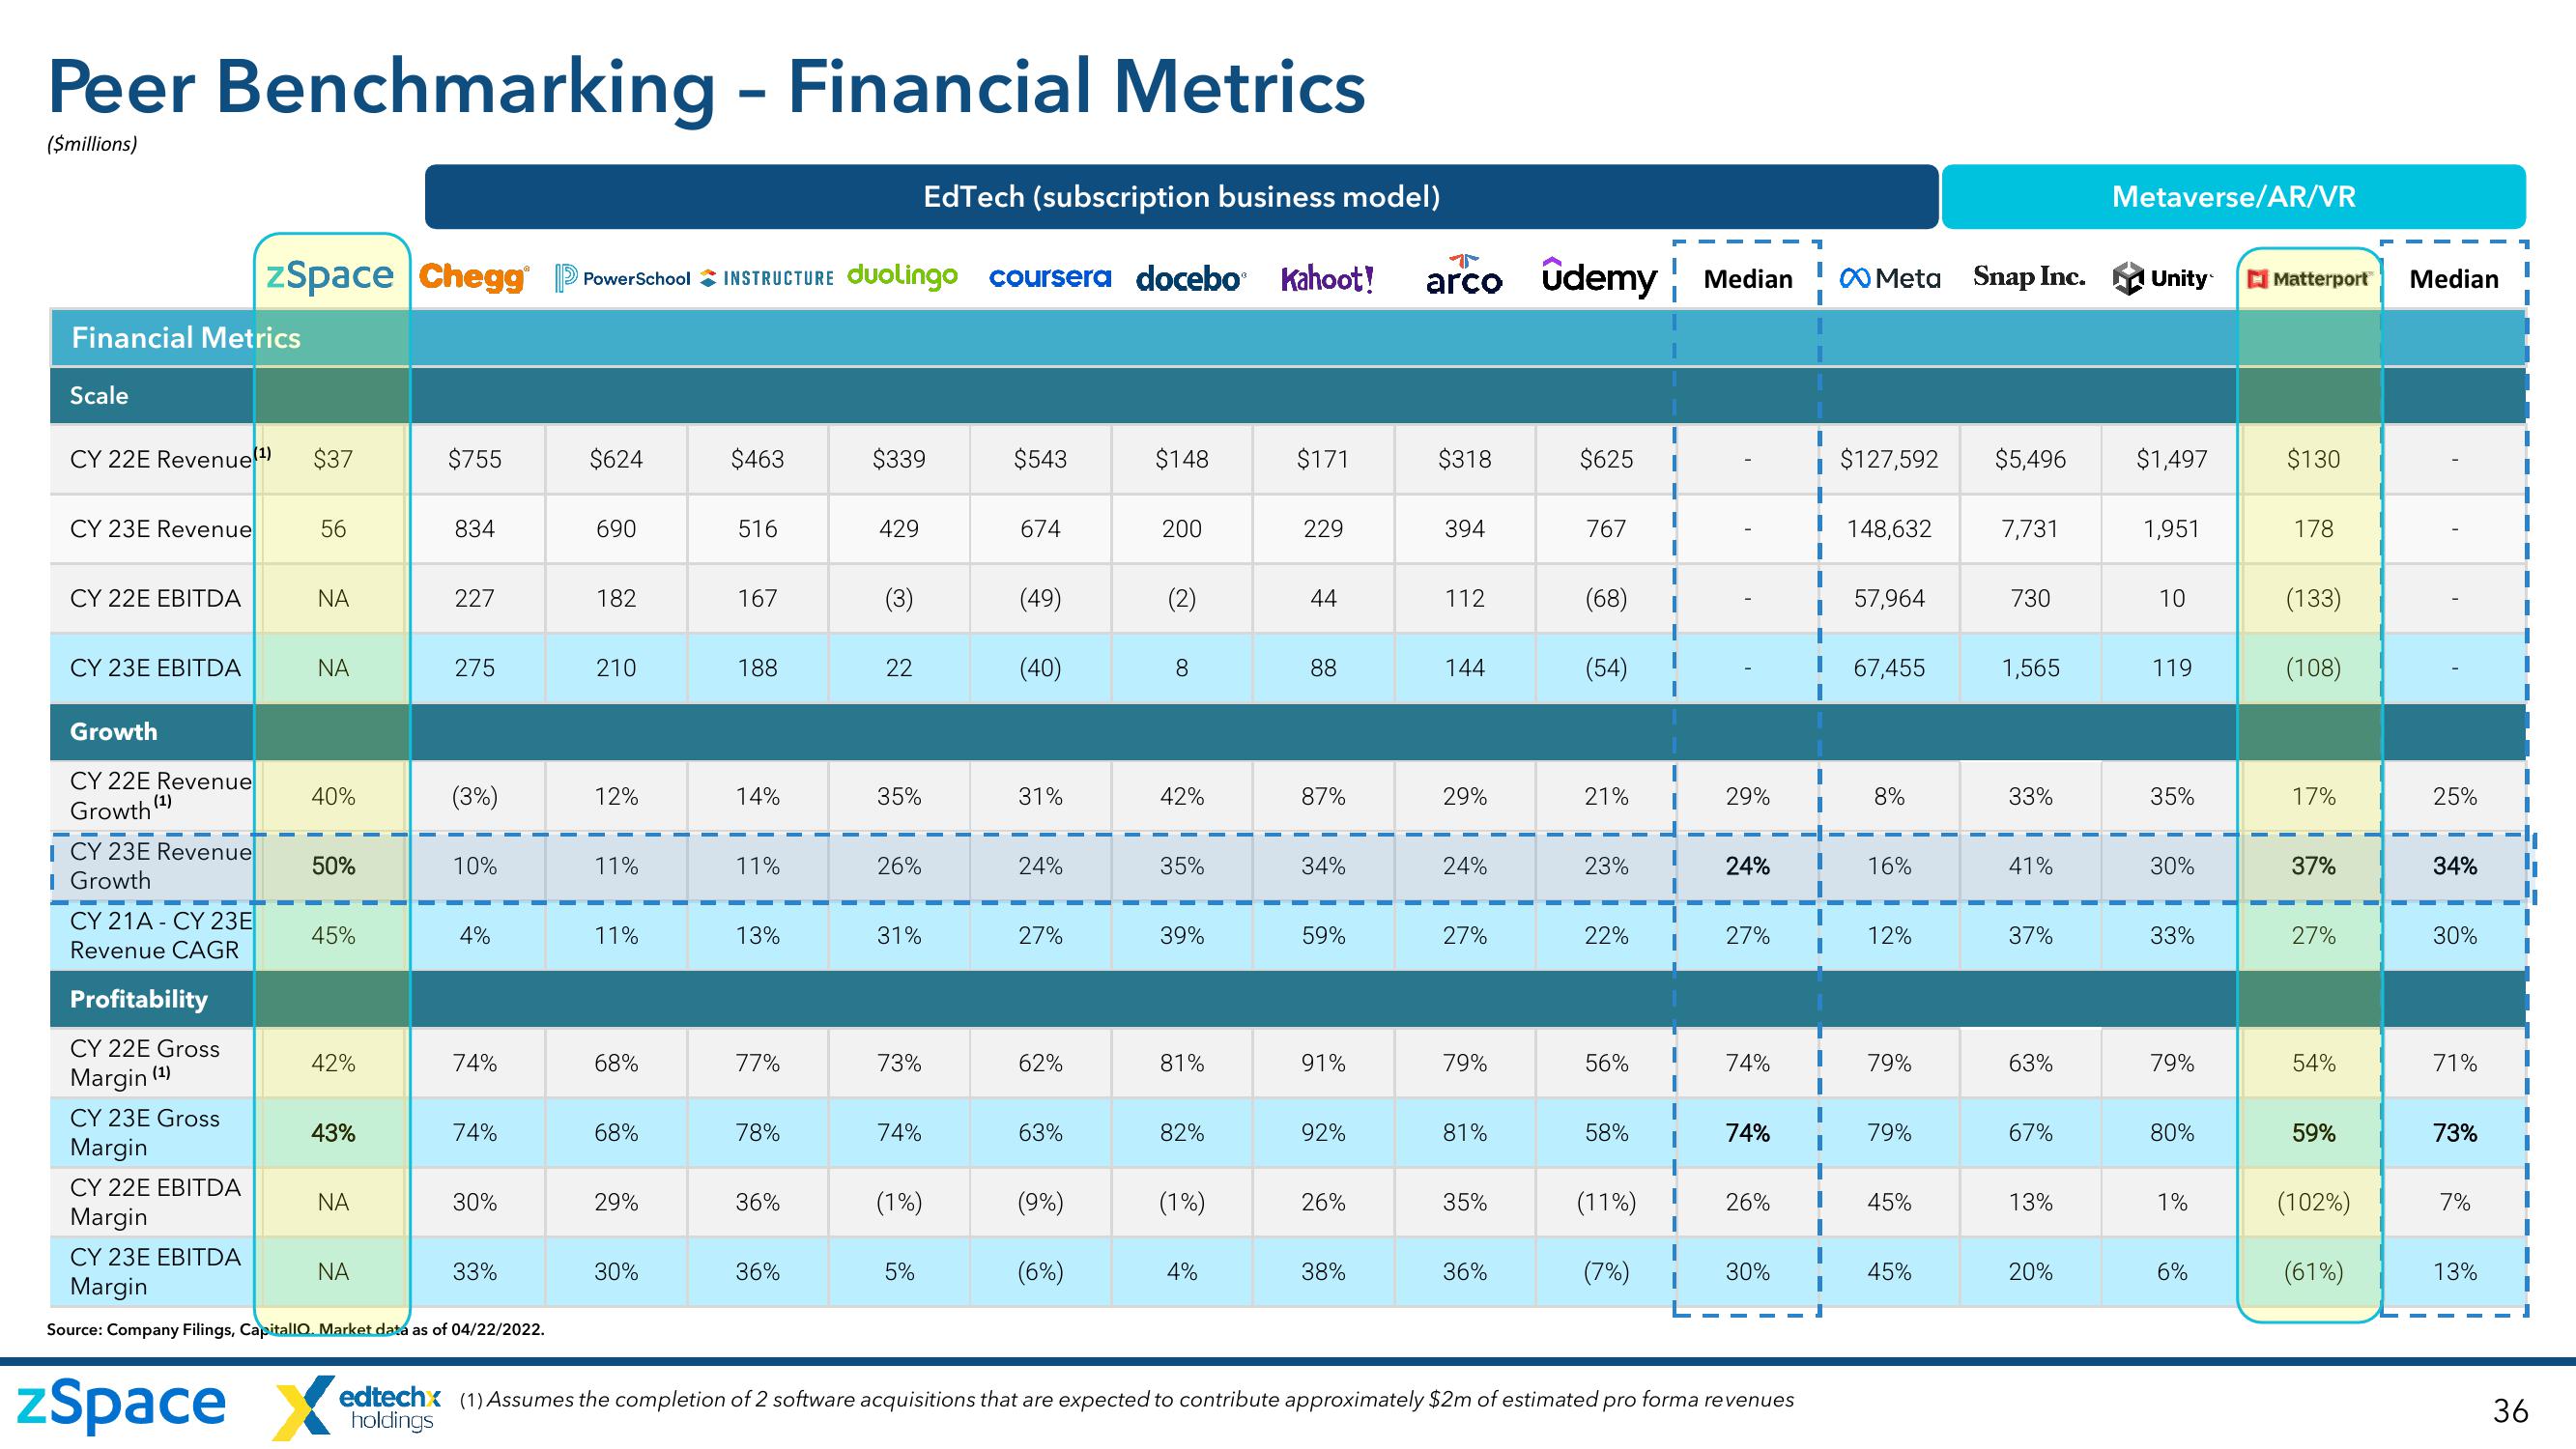
Peer Benchmarking - Financial Metrics
($millions)
Financial Metrics
Scale
CY 22E Revenue (¹) $37
CY 23E Revenue
CY 22E EBITDA
CY 23E EBITDA
Growth
CY 22E Revenue
(1)
Growth
ICY 23E Revenue
I Growth
CY 21ACY 23E
Revenue CAGR
Profitability
CY 22E Gross
Margin (¹)
CY 23E Gross
Margin
zSpace Chegg PowerSchool INSTRUCTURE duolingo coursera docebo Kahoot! arco ûdemy Median
CY 22E EBITDA
Margin
56
ΝΑ
ΝΑ
40%
50%
45%
42%
43%
ΝΑ
$755
ΝΑ
834
227
275
(3%)
10%
4%
74%
74%
30%
CY 23E EBITDA
Margin
Source: Company Filings, CapitallO. Market data as of 04/22/2022.
33%
$624
690
182
210
12%
11%
11%
68%
68%
29%
30%
$463
516
167
188
14%
11%
13%
77%
78%
36%
36%
$339
429
22
35%
26%
31%
73%
EdTech (subscription business model)
74%
(1%)
5%
$543
674
(49)
(40)
31%
24%
27%
62%
63%
(9%)
(6%)
$148
200
(2)
8
42%
35%
39%
81%
82%
(1%)
4%
$171
229
44
88
87%
34%
59%
91%
92%
26%
38%
$318
394
112
144
29%
24%
27%
79%
81%
35%
36%
$625
767
(68)
(54)
21%
23%
22%
56%
58%
(11%)
(7%)
29%
24%
27%
74%
74%
26%
30%
zSpace X edtech (1) Assumes the completion of 2 software acquisitions that are expected to contribute approximately $2m of estimated pro forma revenues
holdings
Meta Snap Inc.
$127,592 $5,496
148,632
57,964
67,455
8%
16%
12%
79%
79%
45%
45%
7,731
730
1,565
33%
41%
37%
63%
67%
13%
20%
Metaverse/AR/VR
Unity
$1,497
1,951
10
119
35%
30%
33%
79%
80%
1%
6%
Matterport Median
$130
178
(133)
(108)
17%
37%
27%
54%
59%
(102%)
(61%)
25%
34%
30%
71%
73%
7%
13%
36View entire presentation