Spring 2023 Solar Industry Update
15
Annual PV Installed (GWdc)
0
5
30
25
•
U.S. Installation Breakdown
Annual: SEIA (GWdc)
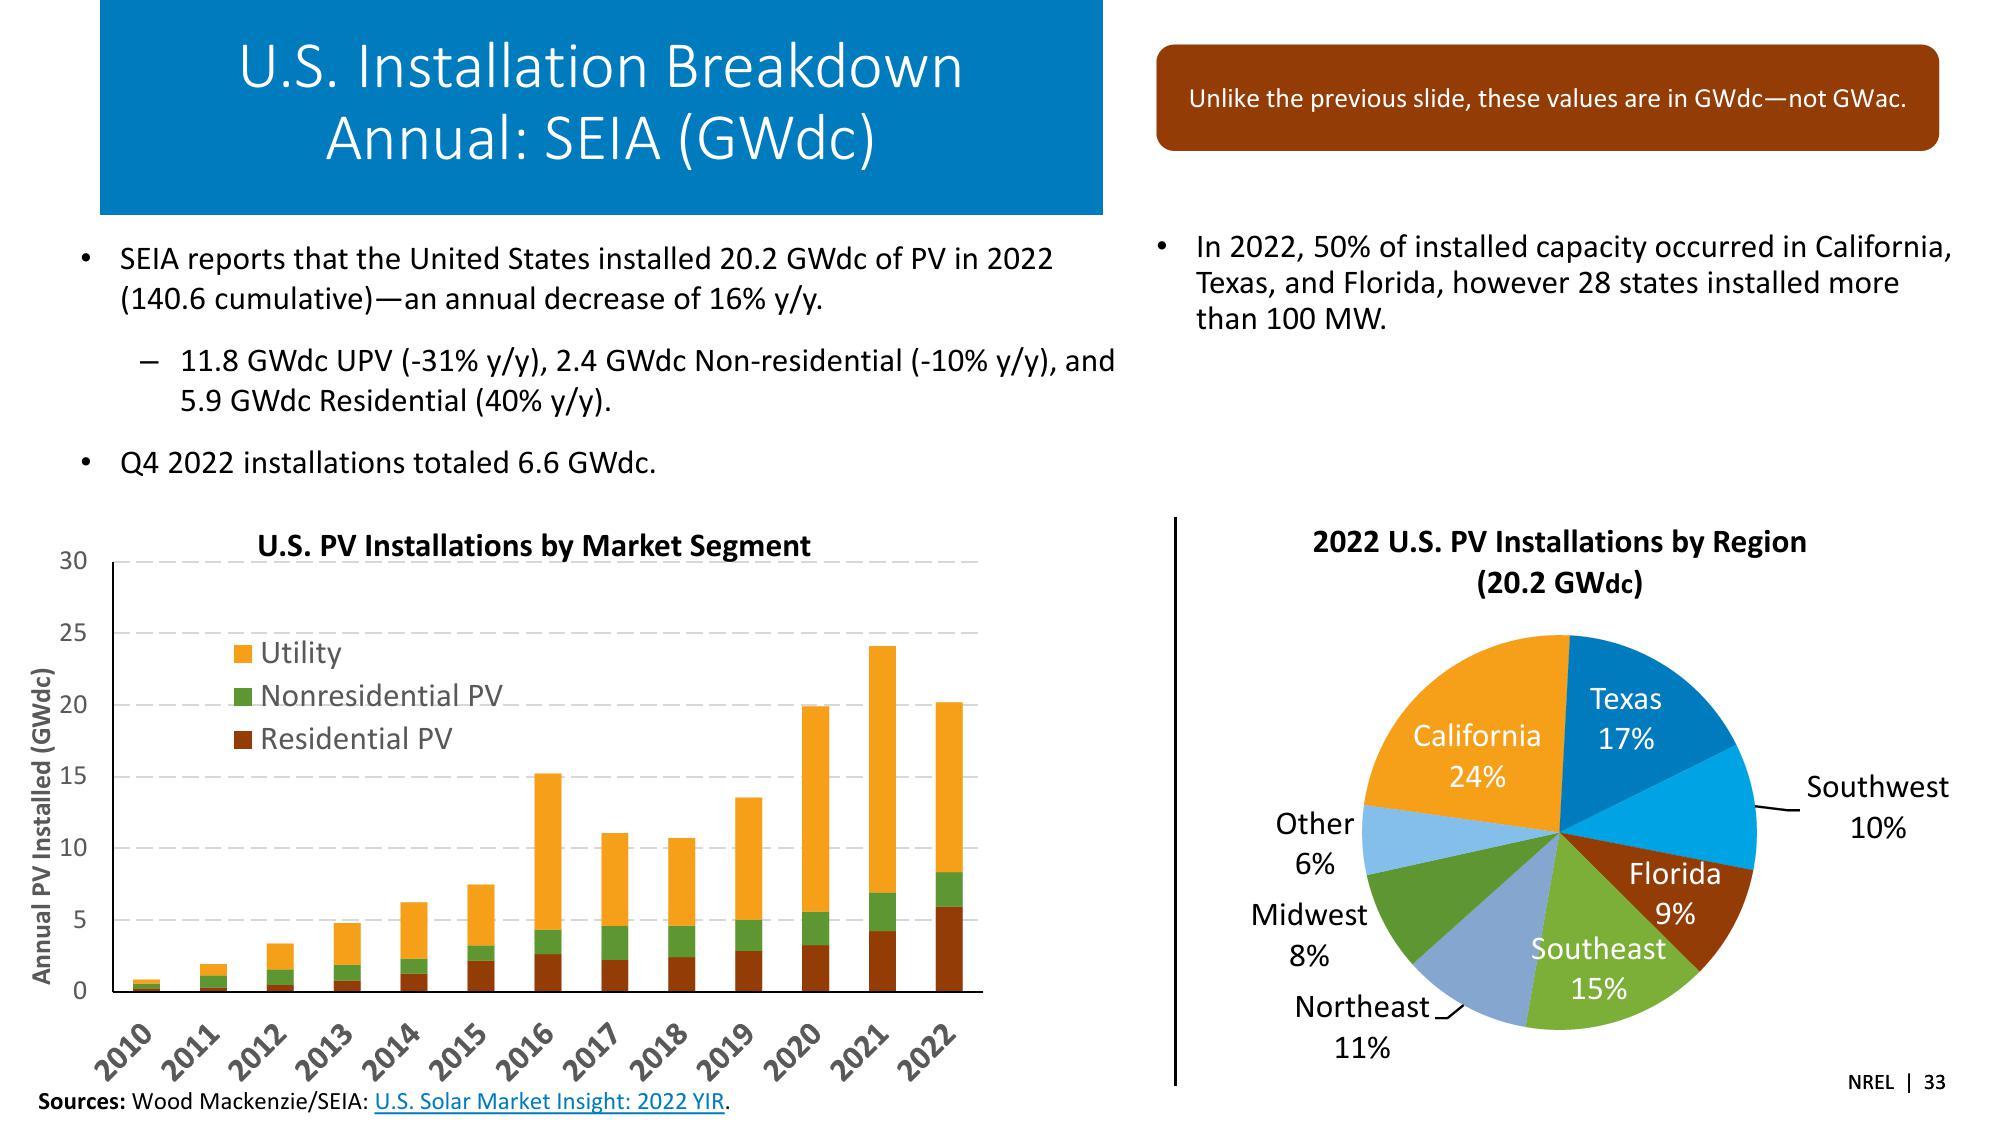
SEIA reports that the United States installed 20.2 GWdc of PV in 2022
(140.6 cumulative)—an annual decrease of 16% y/y.
11.8 GWdc UPV (-31% y/y), 2.4 GWdc Non-residential (-10% y/y), and
5.9 GWdc Residential (40% y/y).
Q4 2022 installations totaled 6.6 GWdc.
U.S. PV Installations by Market Segment
•
Unlike the previous slide, these values are in GWdc-not GWac.
In 2022, 50% of installed capacity occurred in California,
Texas, and Florida, however 28 states installed more
than 100 MW.
2022 U.S. PV Installations by Region
(20.2 GWdc)
2010
2011
2012
Utility
Nonresidential PV
■Residential PV
2013
2014
2015
2016
Sources: Wood Mackenzie/SEIA: U.S. Solar Market Insight: 2022 YIR.
2017
2018
2019
2020
2021
2022
California
24%
Texas
17%
Other
6%
Southwest
10%
Midwest
Florida
9%
8%
Southeast
15%
Northeast
11%
NREL 33View entire presentation