Lyft Results Presentation Deck
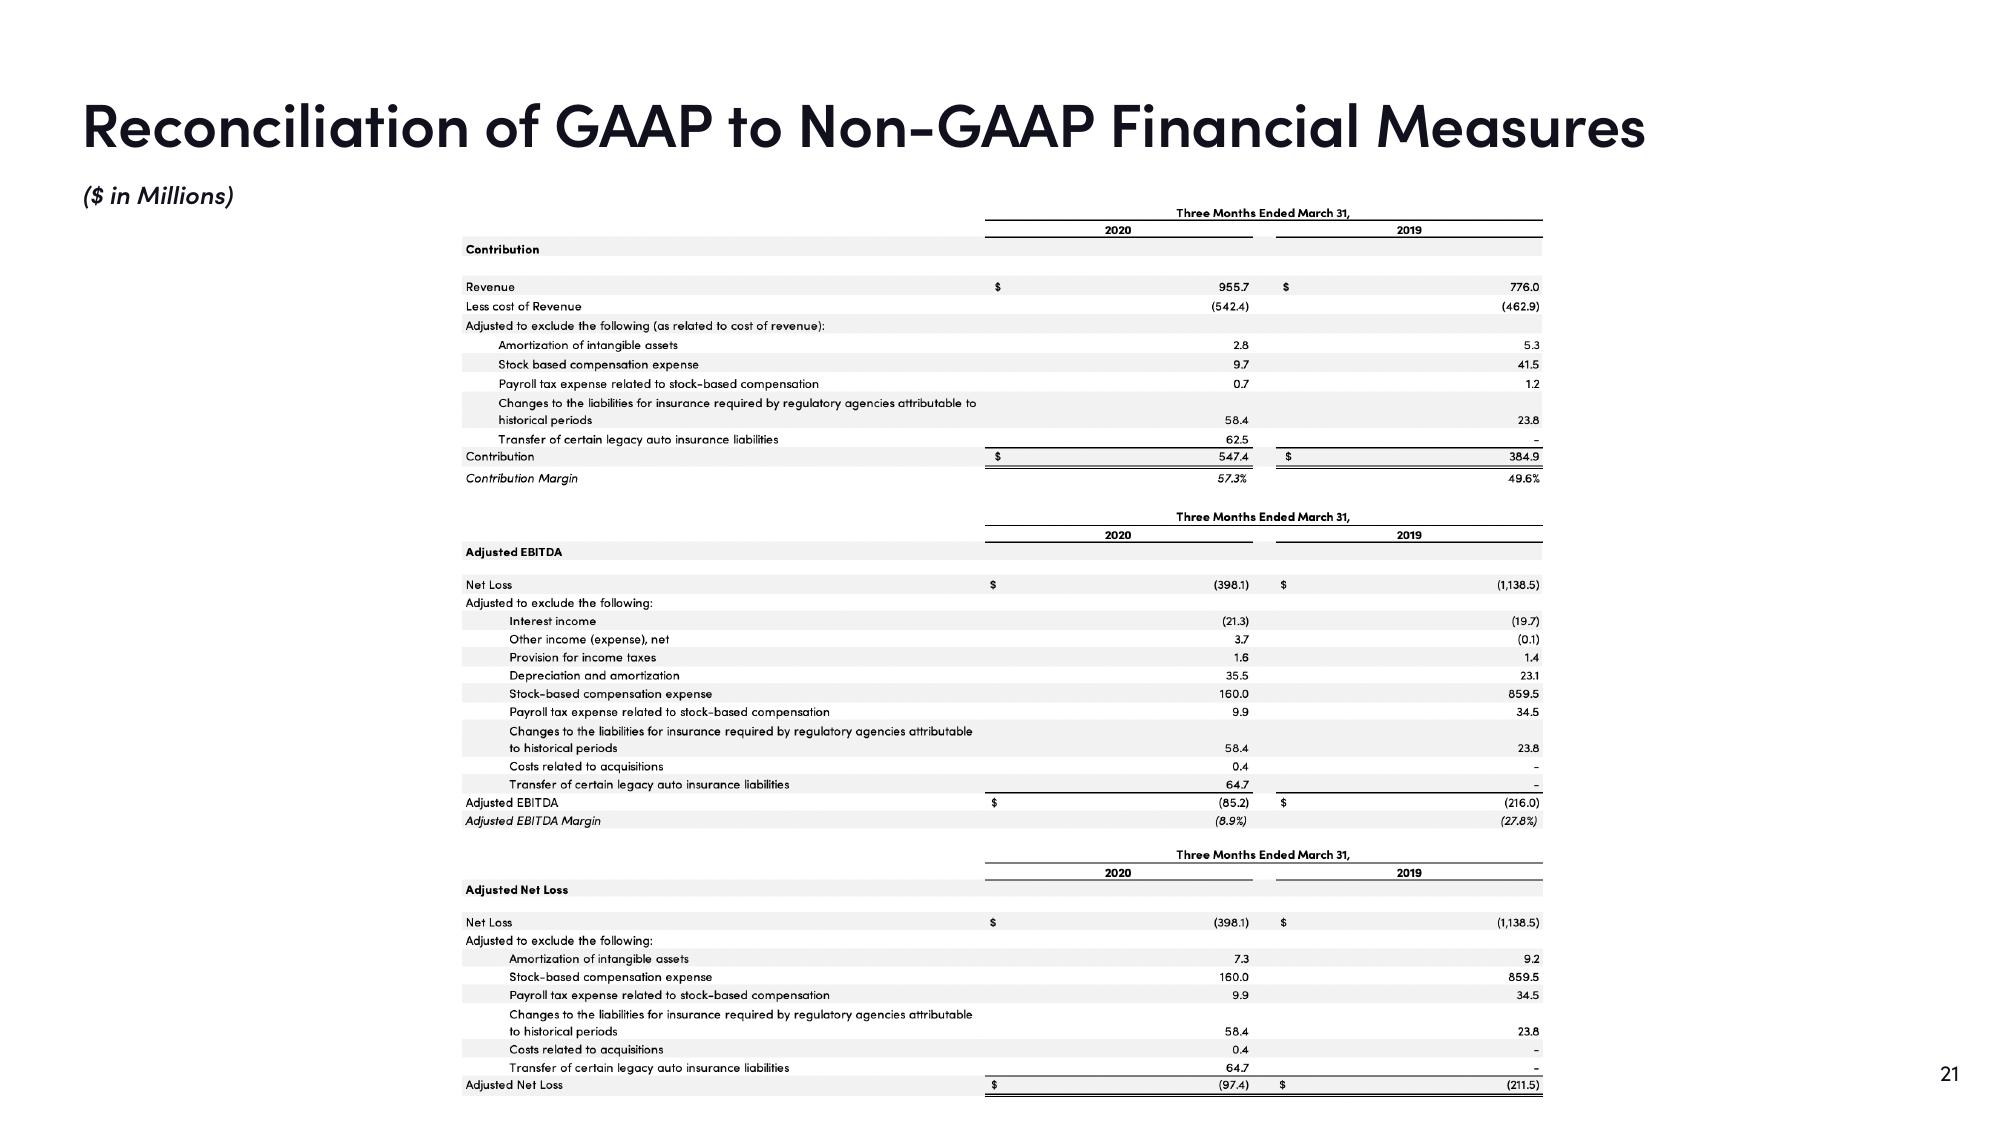
Reconciliation of GAAP to Non-GAAP Financial Measures
($ in Millions)
Contribution
Revenue
Less cost of Revenue
Adjusted to exclude the following (as related to cost of revenue):
Amortization of intangible assets
Stock based compensation expense
Payroll tax expense related to stock-based compensation
Changes to the liabilities for insurance required by regulatory agencies attributable to
historical periods
Transfer of certain legacy auto insurance liabilities
Contribution
Contribution Margin
Adjusted EBITDA
Net Loss
Adjusted to exclude the following:
Interest income
Other income (expense), net
Provision for income taxes
Depreciation and amortization
Stock-based compensation expense
Payroll tax expense related to stock-based compensation
Changes to the liabilities for insurance required by regulatory agencies attributable
to historical periods
Costs related to acquisitions
Transfer of certain legacy auto insurance liabilities
Adjusted EBITDA
Adjusted EBITDA Margin
Adjusted Net Loss
Net Loss
Adjusted to exclude the following:
Amortization of intangible assets
Stock-based compensation expense
Payroll tax expense related to stock-based compensation
Changes to the liabilities for insurance required by regulatory agencies attributable
to historical periods
Costs related to acquisitions
Transfer of certain legacy auto insurance liabilities
Adjusted Net Loss
$
2020
2020
2020
Three Months Ended March 31,
955.7
(542.4)
2.8
9.7
0.7
58.4
62.5
547.4
57.3%
Three Months Ended March 31,
(398.1)
(21.3)
3.7
1.6
35.5
160.0
9.9
58.4
0.4
64.7
(85.2)
(8.9%)
(398.1)
$
Three Months Ended March 31,
7.3
160.0
9.9
58.4
0.4
64.7
(97.4)
$
$
$
2019
2019
2019
776.0
(462.9)
5.3
41.5
1.2
23.8
384.9
49.6%
(1,138.5)
(19.7)
(0.1)
1.4
23.1
859.5
34.5
23.8
(216.0)
(27.8%)
(1,138.5)
9.2
859.5
34.5
23.8
(211.5)
21View entire presentation