Cboe Results Presentation Deck
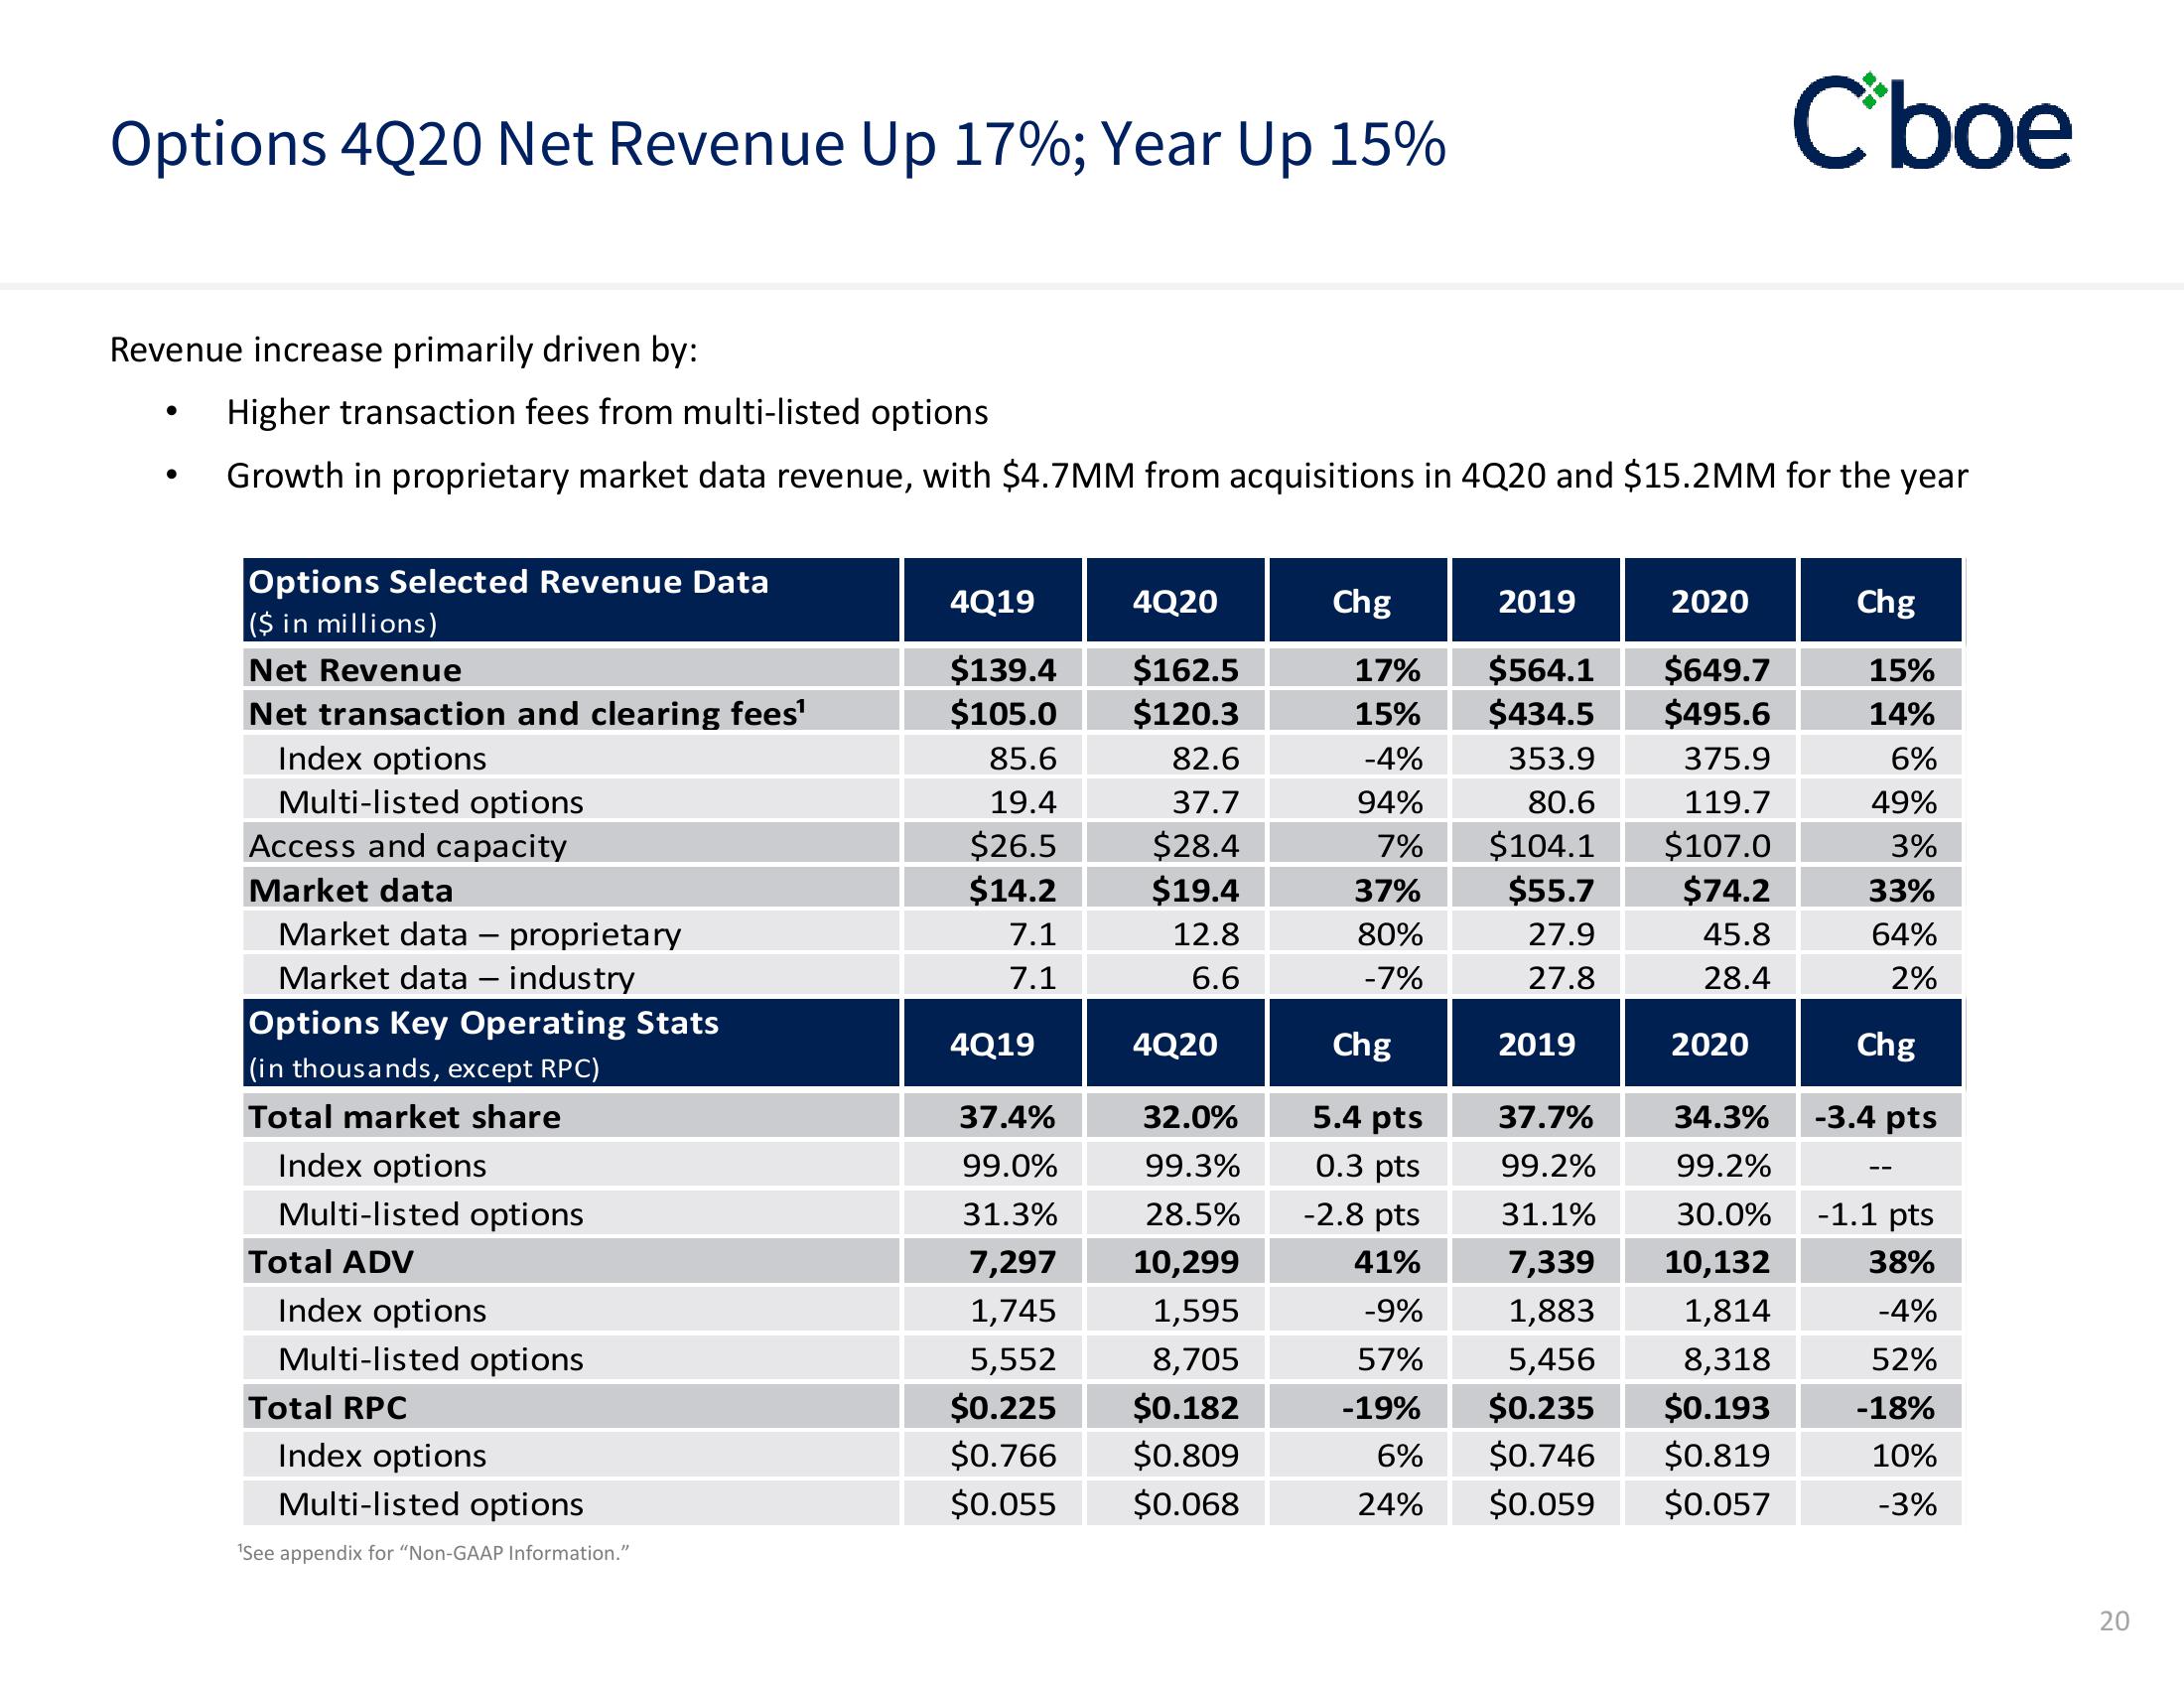
Options 4Q20 Net Revenue Up 17%; Year Up 15%
Revenue increase primarily driven by:
●
Higher transaction fees from multi-listed options
Growth in proprietary market data revenue, with $4.7MM from acquisitions in 4Q20 and $15.2MM for the year
Options Selected Revenue Data
($ in millions)
Net Revenue
Net transaction and clearing fees¹
Index options
Multi-listed options
Access and capacity
Market data
Market data - proprietary
Market data - industry
Options Key Operating Stats
(in thousands, except RPC)
Total market share
Index options
Multi-listed options
Total ADV
Index options
Multi-listed options
Total RPC
Index options
Multi-listed options
¹See appendix for "Non-GAAP Information."
4Q19
$139.4
$105.0
85.6
19.4
$26.5
$14.2
7.1
7.1
4Q19
4Q20
$162.5
$120.3
82.6
37.7
$28.4
$19.4
12.8
6.6
4Q20
37.4%
32.0%
99.0%
99.3%
31.3%
28.5%
7,297
10,299
1,745
1,595
5,552
8,705
$0.225
$0.182
$0.766 $0.809
$0.055 $0.068
Chg
17%
15%
-4%
94%
7%
37%
80%
-7%
Chg
5.4 pts
0.3 pts
-2.8 pts
41%
-9%
57%
-19%
6%
24%
2019
$564.1
$434.5
353.9
80.6
$104.1
$55.7
27.9
27.8
2019
2020
$649.7
$495.6
375.9
119.7
$107.0
$74.2
45.8
28.4
2020
Cboe
37.7%
34.3%
99.2%
99.2%
31.1%
30.0%
7,339
10,132
1,883
1,814
5,456
8,318
$0.235
$0.193
$0.746 $0.819
$0.059 $0.057
Chg
15%
14%
6%
49%
3%
33%
64%
2%
Chg
-3.4 pts
-1.1 pts
38%
-4%
52%
-18%
10%
-3%
20View entire presentation