Vivid Seats Results Presentation Deck
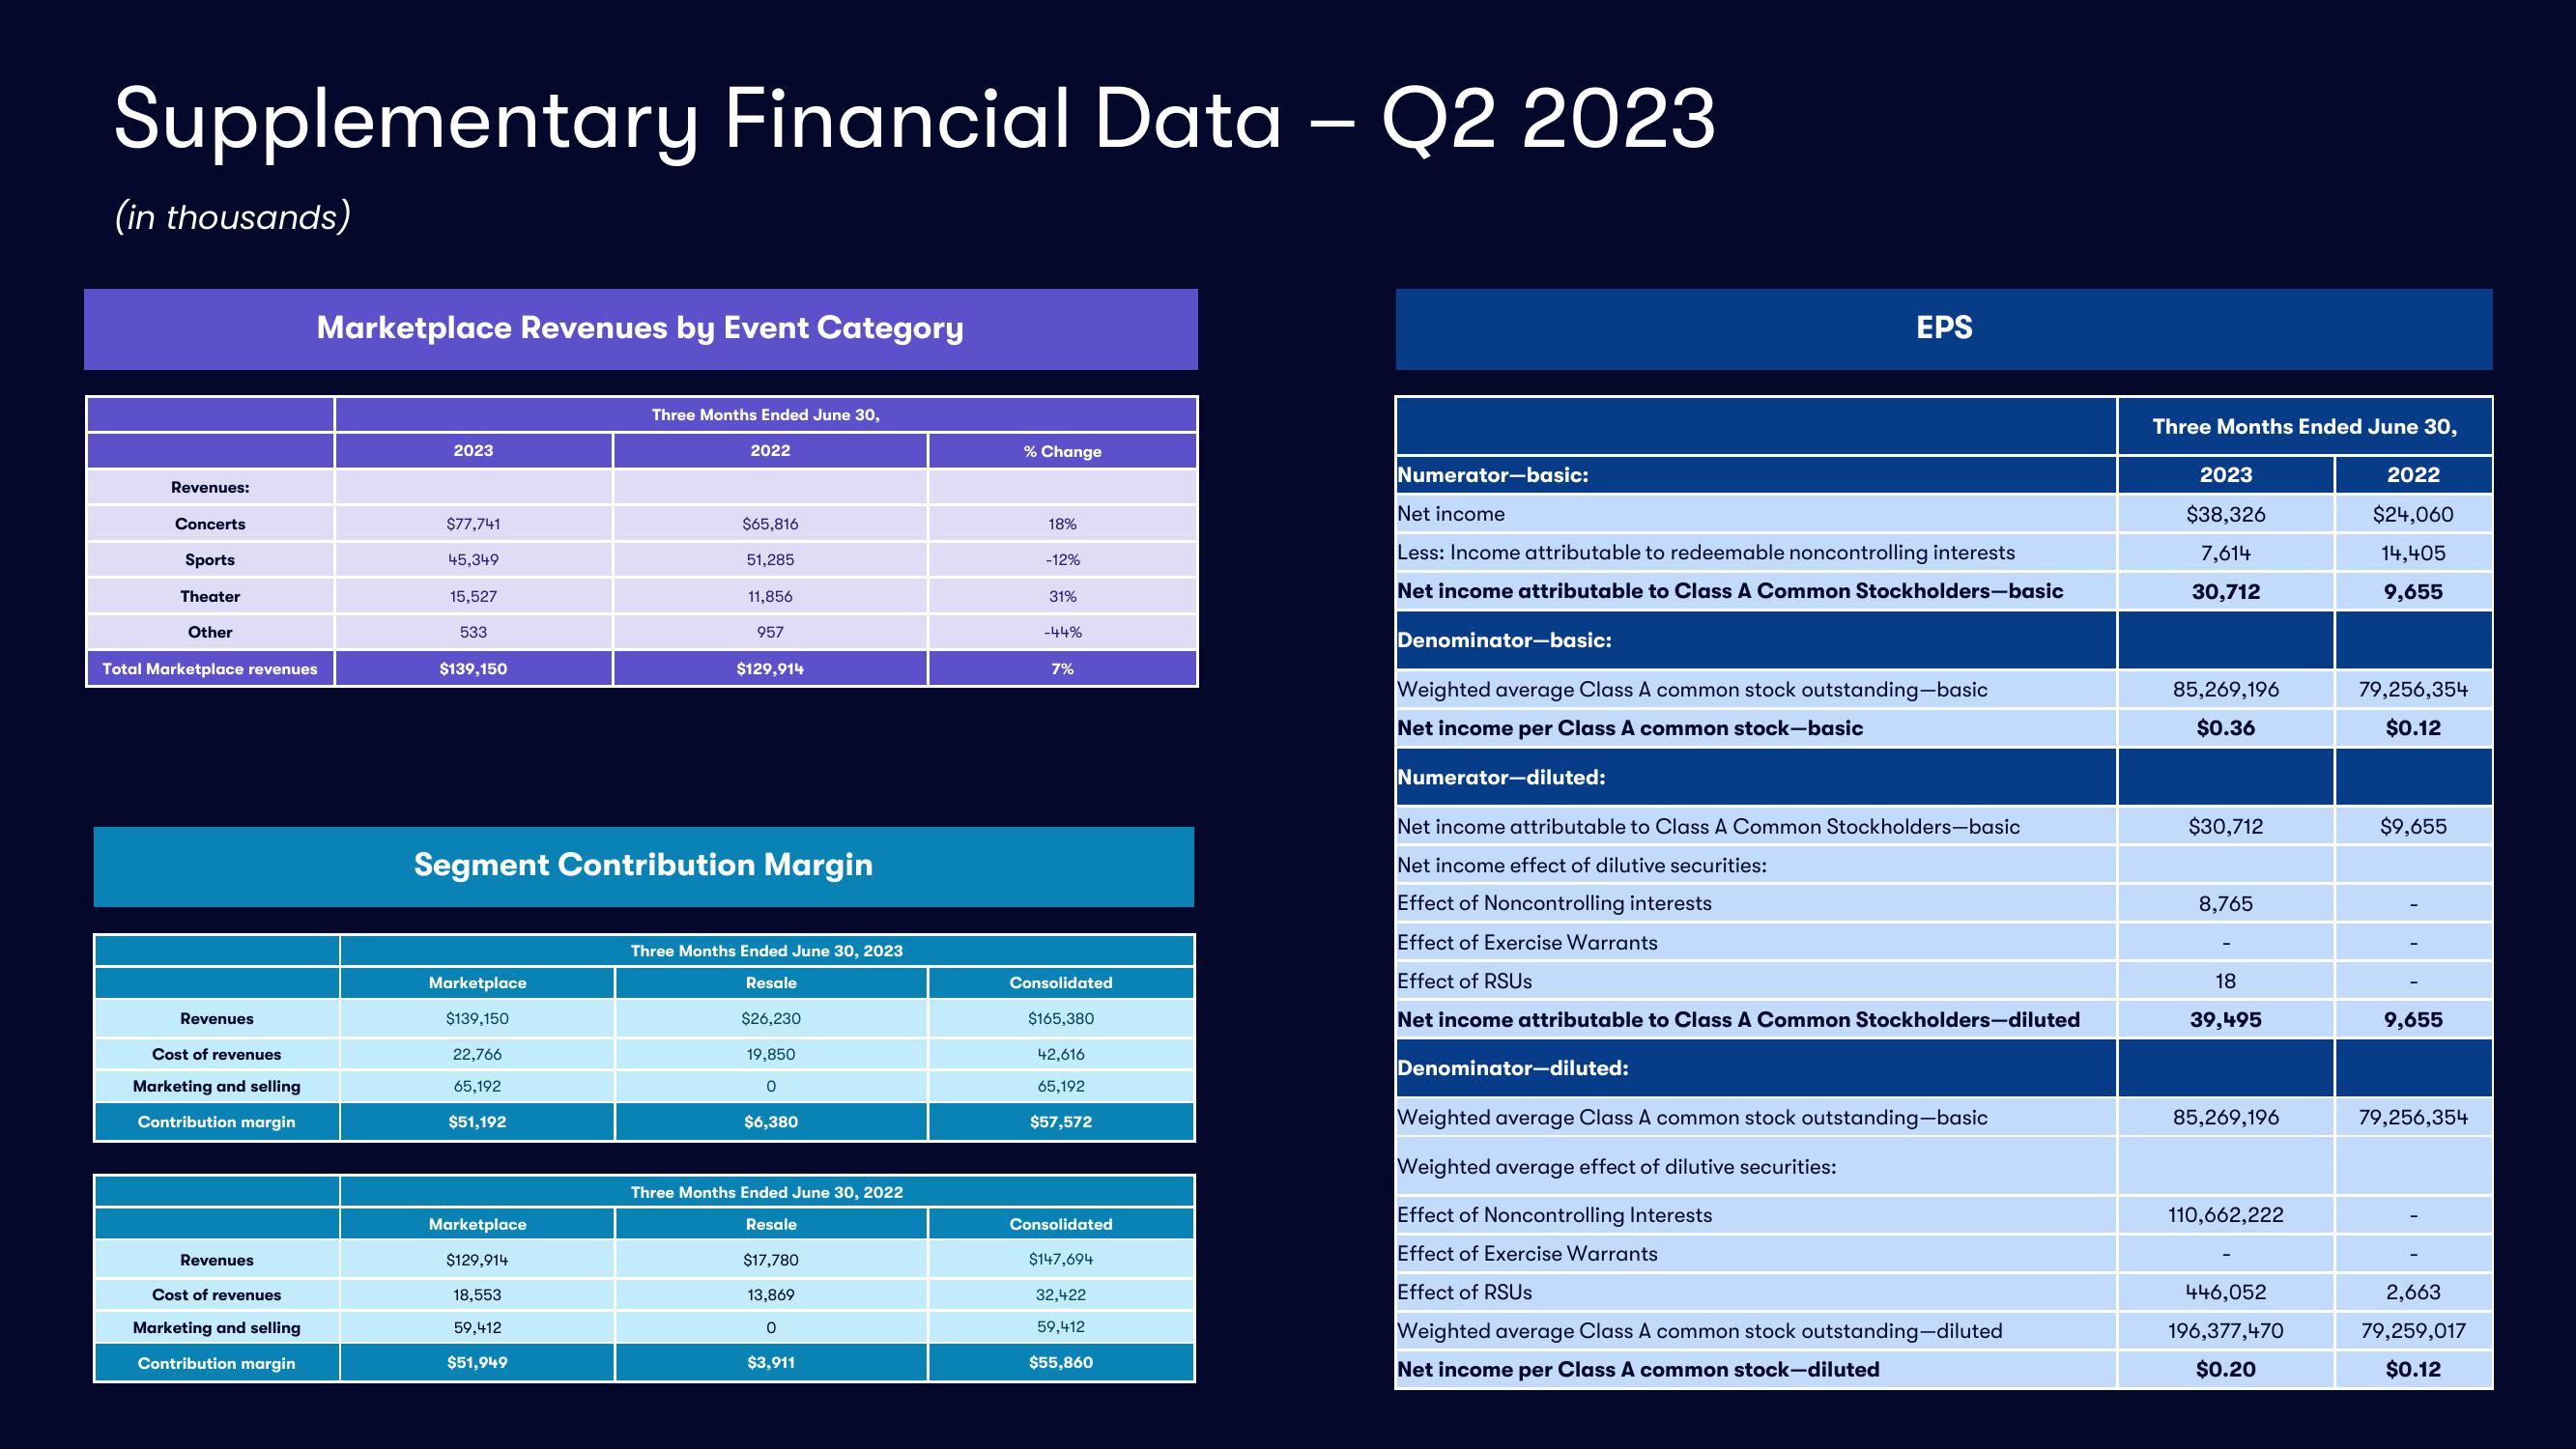
Supplementary Financial Data - Q2 2023
(in thousands)
Revenues:
Concerts
Sports
Theater
Other
Total Marketplace revenues
Revenues
Cost of revenues
Marketing and selling
Contribution margin
Revenues
Marketplace Revenues by Event Category
Cost of revenues
Marketing and selling
Contribution margin
2023
$77,741
45,349
15,527
533
$139,150
Marketplace
$139,150
22,766
65,192
$51,192
Three Months Ended June 30,
Marketplace
$129,914
18,553
59,412
$51,949
2022
$65,816
51,285
11,856
957
Segment Contribution Margin
$129,914
Three Months Ended June 30, 2023
Resale
$26,230
19,850
0
$6,380
Three Months Ended June 30, 2022
Resale
$17,780
13,869
0
$3,911
% Change
18%
-12%
31%
-44%
7%
Consolidated
$165,380
42,616
65,192
$57,572
Consolidated
$147,694
32,422
59,412
$55,860
Numerator-basic:
Net income
Less: Income attributable to redeemable noncontrolling interests
Net income attributable to Class A Common Stockholders-basic
Denominator-basic:
EPS
Weighted average Class A common stock outstanding-basic
Net income per Class A common stock-basic
Numerator-diluted:
Net income attributable to Class A Common Stockholders-basic
Net income effect of dilutive securities:
Effect of Noncontrolling interests
Effect of Exercise Warrants
Effect of RSUS
Net income attributable to Class A Common Stockholders-diluted
Denominator-diluted:
Weighted average Class A common stock outstanding-basic
Weighted average effect of dilutive securities:
Effect of Noncontrolling Interests
Effect of Exercise Warrants
Effect of RSUS
Weighted average Class A common stock outstanding-diluted
Net income per Class A common stock-diluted
Three Months Ended June 30,
2023
$38,326
7,614
30,712
85,269,196
$0.36
$30,712
8,765
18
39,495
85,269,196
110,662,222
446,052
196,377,470
$0.20
2022
$24,060
14,405
9,655
79,256,354
$0.12
$9,655
9,655
79,256,354
2,663
79,259,017
$0.12View entire presentation