Rigetti SPAC Presentation Deck
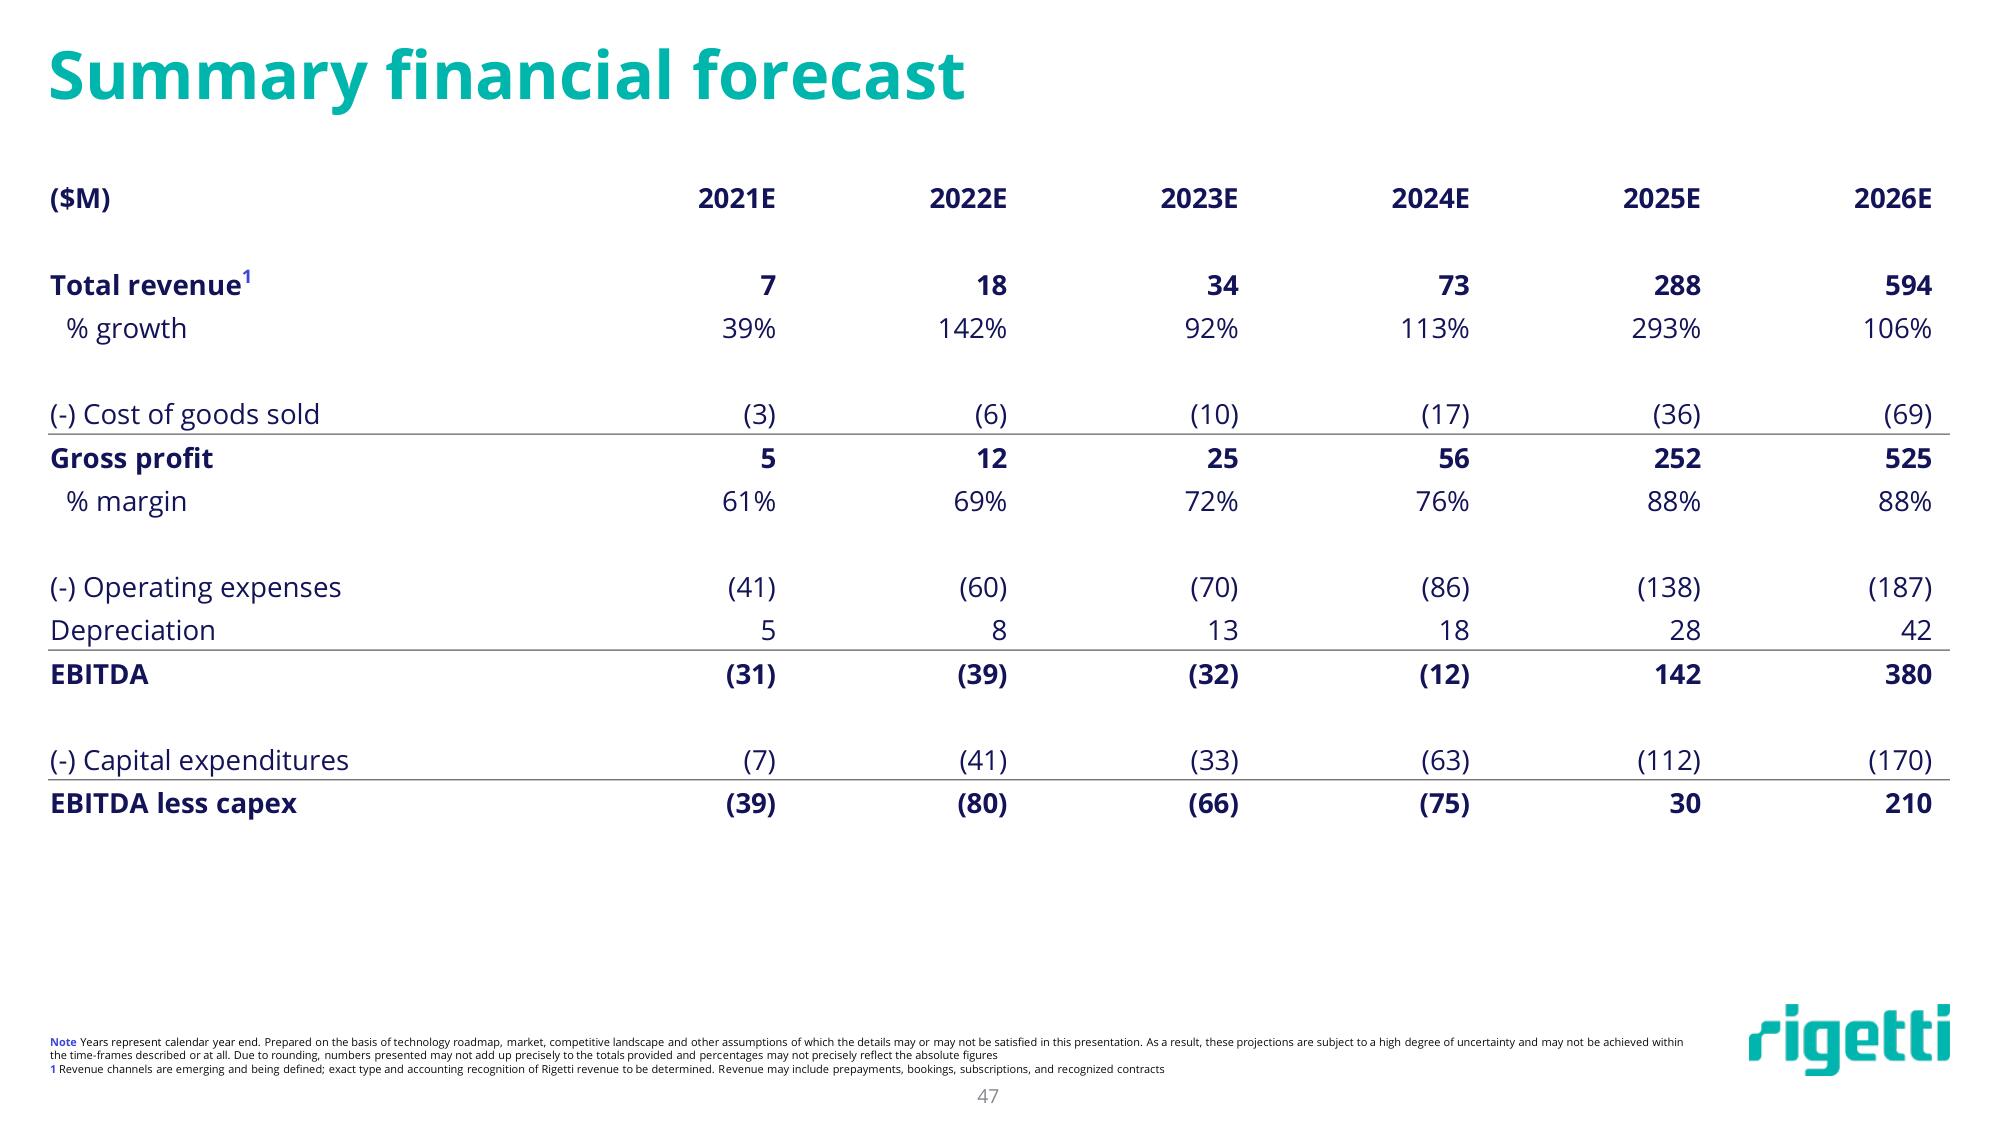
Summary financial forecast
($M)
Total revenue¹
% growth
(-) Cost of goods sold
Gross profit
% margin
(-) Operating expenses
Depreciation
EBITDA
(-) Capital expenditures
EBITDA less capex
2021E
7
39%
(3)
5
61%
(41)
5
(31)
(7)
(39)
2022E
18
142%
(6)
12
69%
(60)
8
(39)
(41)
(80)
2023E
34
92%
(10)
25
72%
(70)
13
(32)
(33)
(66)
2024E
73
113%
(17)
56
76%
(86)
18
(12)
(63)
(75)
2025E
288
293%
(36)
252
88%
(138)
28
142
(112)
30
Note Years represent calendar year end. Prepared on the basis of technology roadmap, market, competitive landscape and other assumptions of which the details may or may not be satisfied in this presentation. As a result, these projections are subject to a high degree of uncertainty and may not be achieved within
the time-frames described or at all. Due to rounding, numbers presented may not add up precisely to the totals provided and percentages may not precisely reflect the absolute figures
1 Revenue channels are emerging and being defined; exact type and accounting recognition of Rigetti revenue to be determined. Revenue may include prepayments, bookings, subscriptions, and recognized contracts
47
2026E
594
106%
(69)
525
88%
(187)
42
380
(170)
210
rigettiView entire presentation