Uber Results Presentation Deck
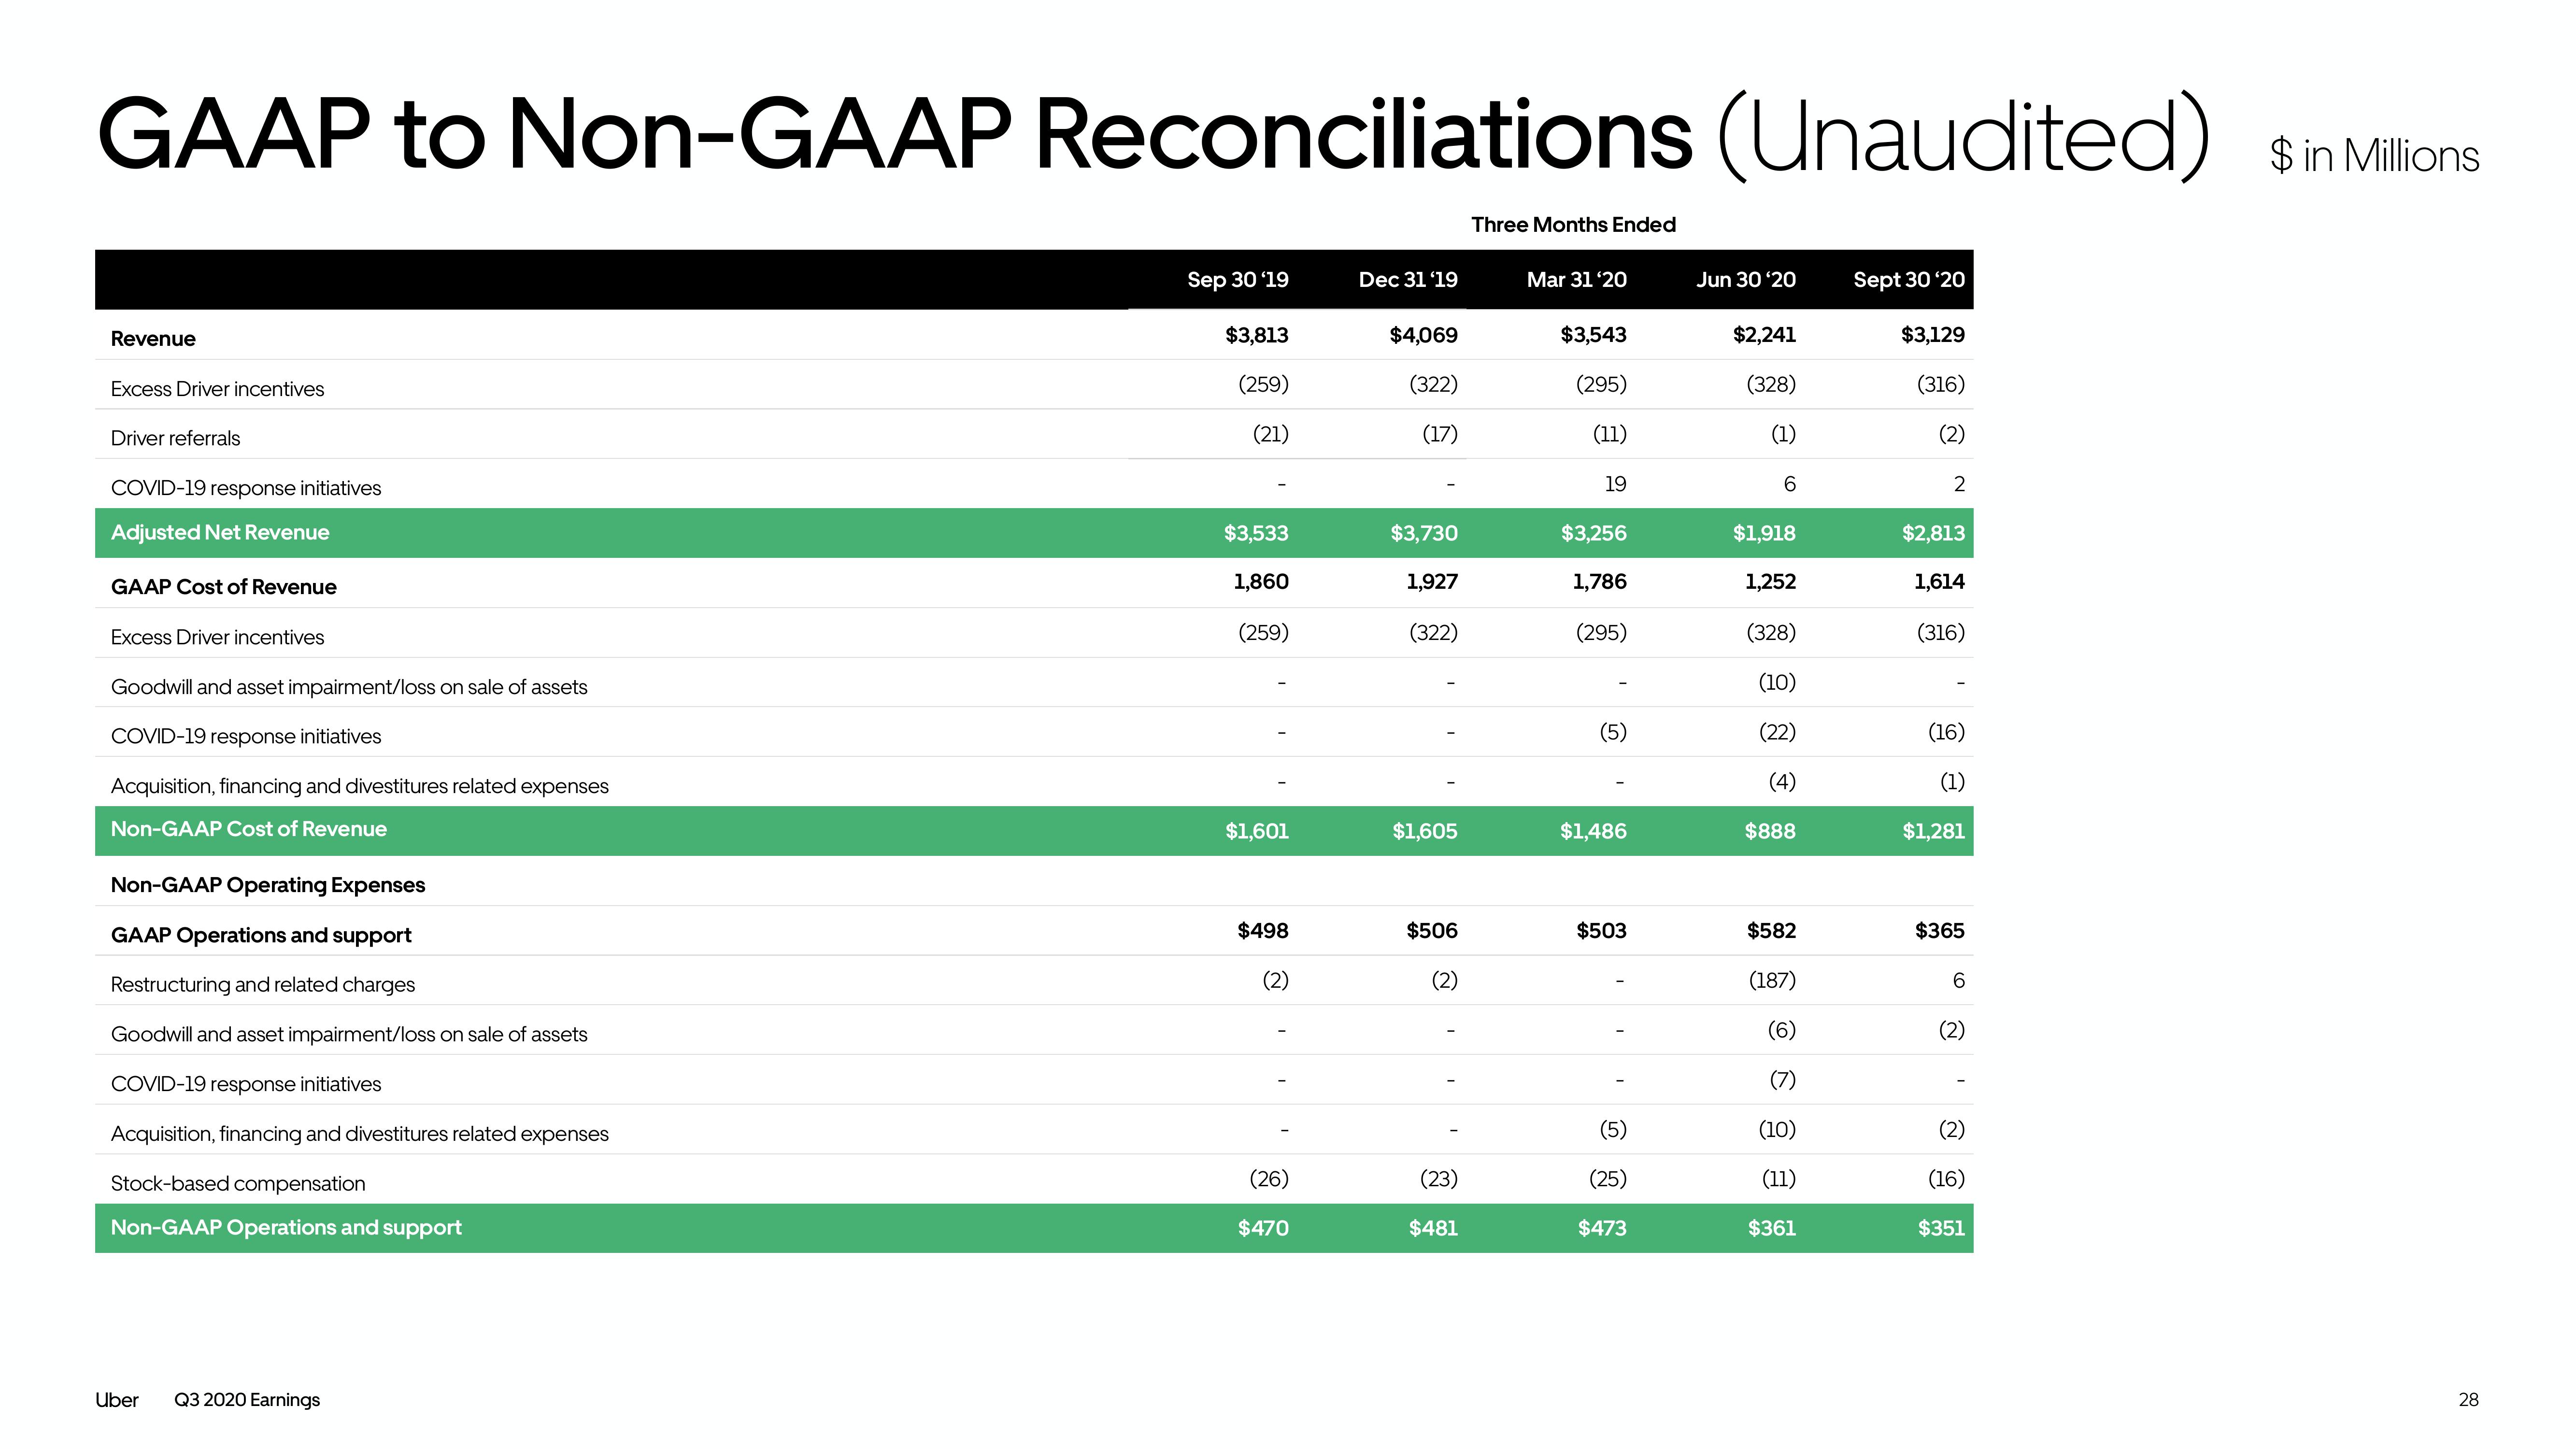
GAAP to Non-GAAP Reconciliations (Unaudited)
Revenue
Excess Driver incentives
Driver referrals
COVID-19 response initiatives
Adjusted Net Revenue
GAAP Cost of Revenue
Excess Driver incentives
Goodwill and asset impairment/loss on sale of assets
COVID-19 response initiatives
Acquisition, financing and divestitures related expenses
Non-GAAP Cost of Revenue
Non-GAAP Operating Expenses
GAAP Operations and support
Restructuring and related charges
Goodwill and asset impairment/loss on sale of assets
COVID-19 response initiatives
Acquisition, financing and divestitures related expenses
Stock-based compensation
Non-GAAP Operations and support
Uber Q3 2020 Earnings
Sep 30'19
$3,813
(259)
(21)
$3,533
1,860
(259)
$1,601
$498
(2)
(26)
$470
Dec 31 '19
$4,069
(322)
(17)
$3,730
1,927
(322)
$1,605
$506
(2)
(23)
$481
Three Months Ended
Mar 31'20
$3,543
(295)
(11)
19
$3,256
1,786
(295)
(5)
$1,486
$503
(5)
(25)
$473
Jun 30'20
$2,241
(328)
(1)
6
$1,918
1,252
(328)
(10)
(22)
(4)
$888
$582
(187)
(6)
(7)
(10)
(11)
$361
Sept 30'20
$3,129
(316)
(2)
2
$2,813
1,614
(316)
(16)
(1)
$1,281
$365
6
(2)
(2)
(16)
$351
$ in Millions
28View entire presentation