Inovalon Results Presentation Deck slide image

Inovalon Results Presentation Deck

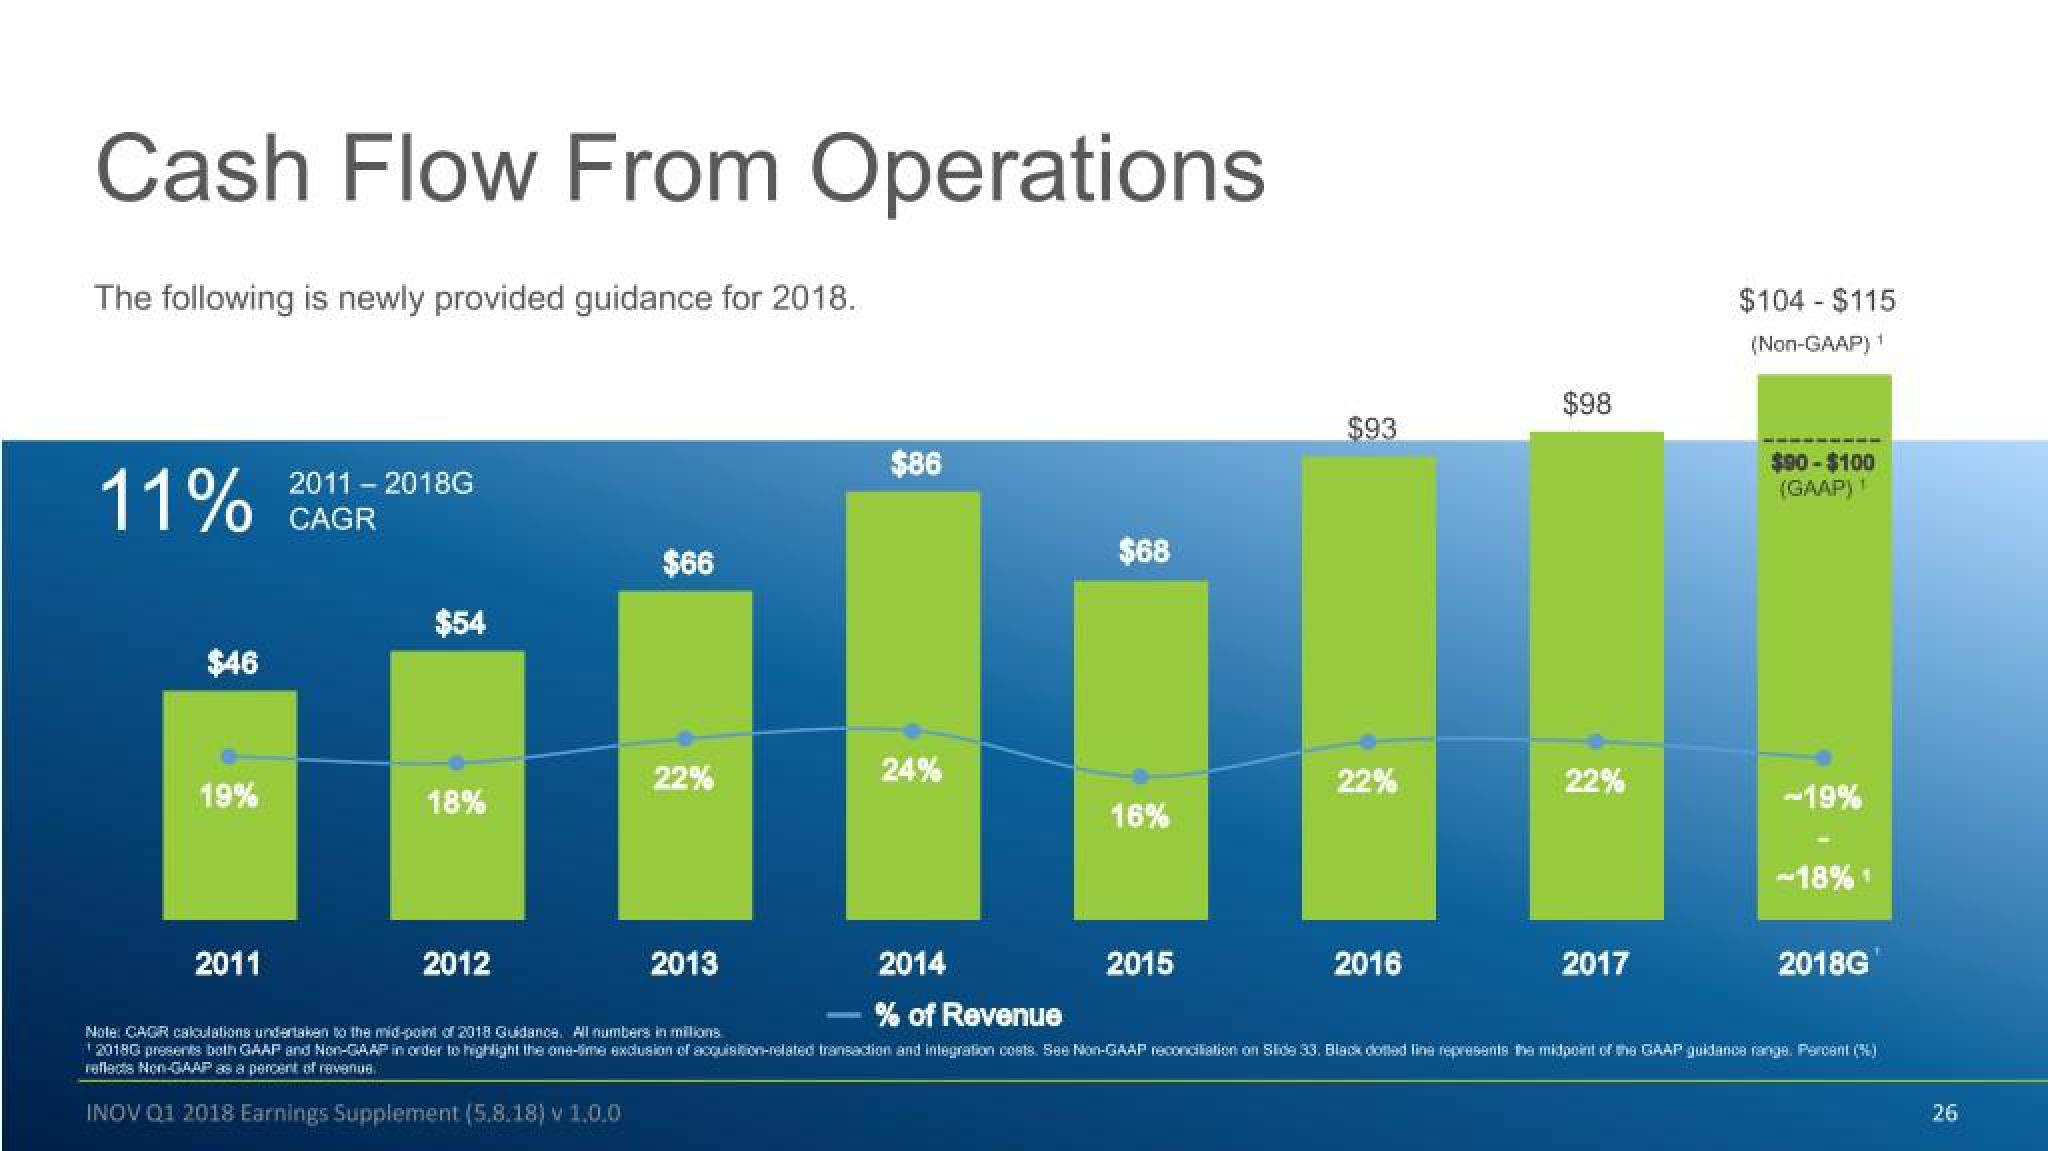
Cash Flow From Operations The following is newly provided guidance for 2018. 11% $46 19% 2011-2018G CAGR 2011 $54 18% $66 2012 22% $86 2013 24% $68 16% $93 2015 22% $98 2016 22% 2014 % of Revenue Note: CAGR calculations undertaken to the mid-point of 2018 Guidance. All numbers in millions 20180 presents both GAAP and Non-GAAP in order to highlight the one-time exclusion of acquisition-related transaction and integration costs. See Non-GAAP reconciliation on Slide 33. Black dotted line represents the midpoint of the GAAP guidance range. Percent (%) reflects Non-GAAP as a percent of revenue INOV Q1 2018 Earnings Supplement (5.8.18) v 1.0.0 $104 - $115 (Non-GAAP) ¹ 2017 $90-$100 (GAAP) ¹ -19% -18% 1 2018G 26
View entire presentation