CorpAcq SPAC Presentation Deck
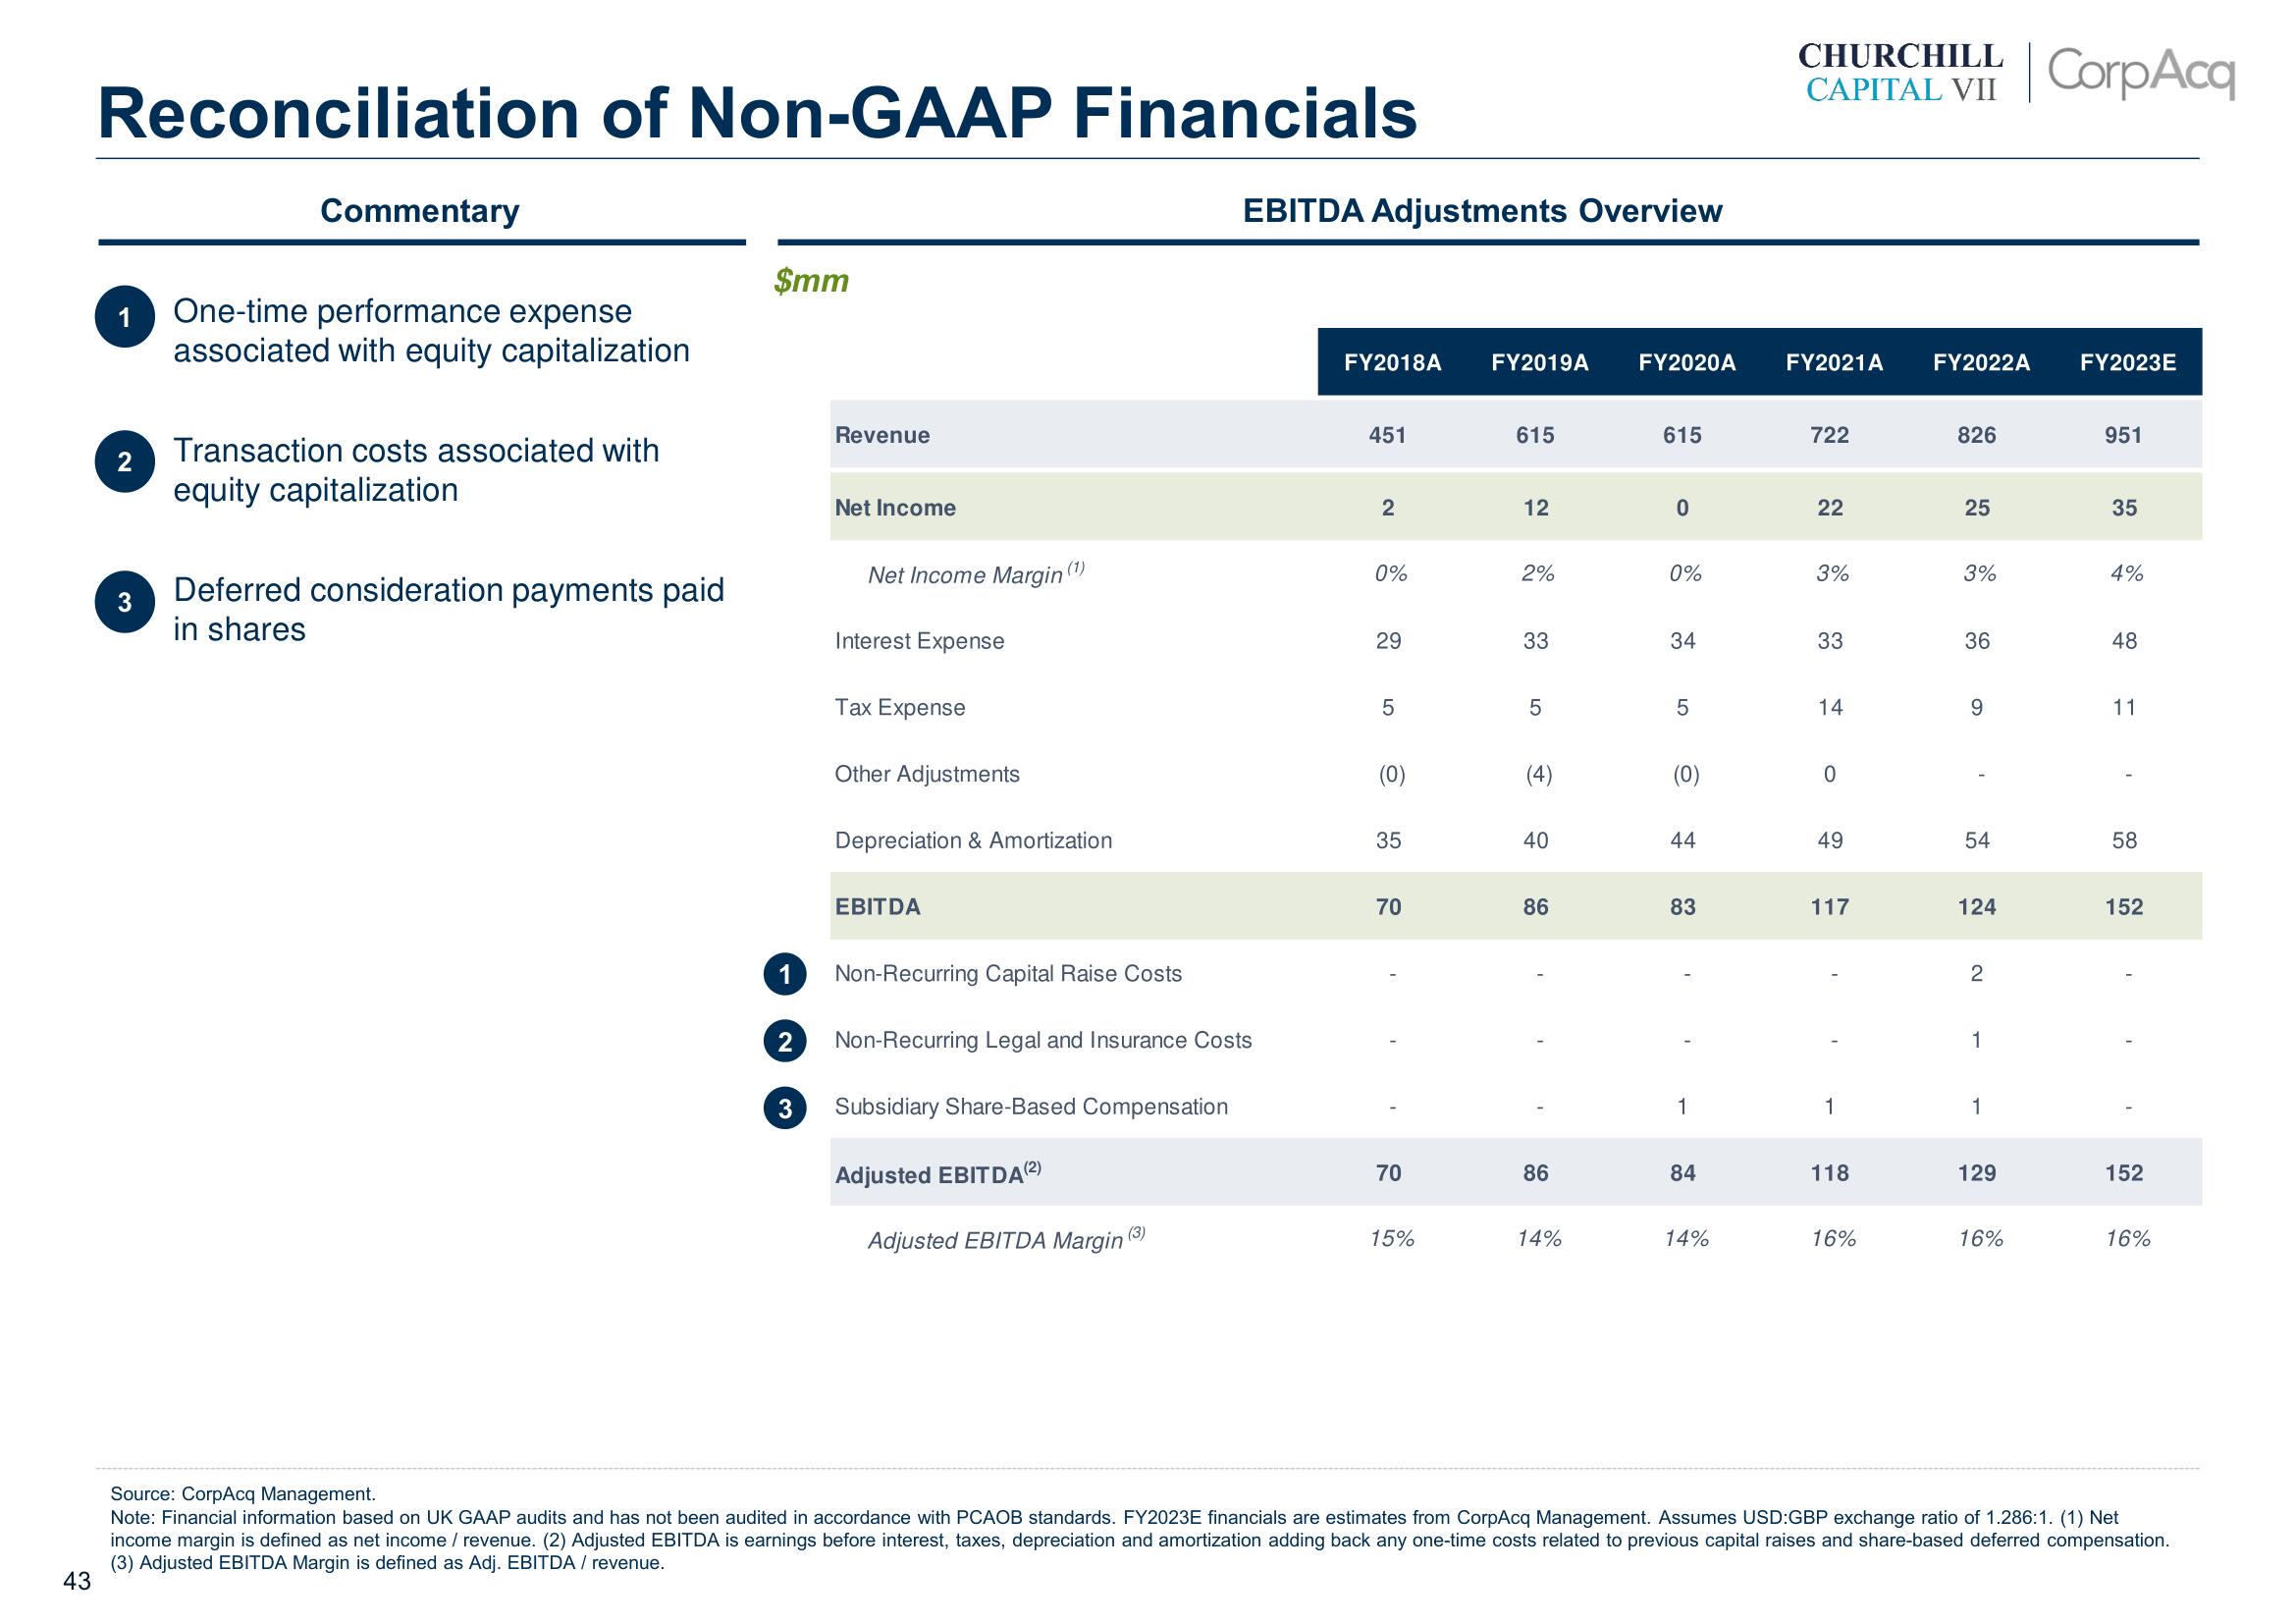
Reconciliation of Non-GAAP Financials
1
2
3
Commentary
One-time performance expense
associated with equity capitalization
Transaction costs associated with
equity capitalization
Deferred consideration payments paid
in shares
$mm
1
2
3
Revenue
Net Income
Net Income Margin (¹)
Interest Expense
Tax Expense
Other Adjustments
Depreciation & Amortization
EBITDA
Non-Recurring Capital Raise Costs
Non-Recurring Legal and Insurance Costs
Subsidiary Share-Based Compensation
Adjusted EBITDA (²)
Adjusted EBITDA Margin
EBITDA Adjustments Overview
(3)
FY2018A
451
2
0%
29
5
(0)
35
70
70
15%
FY2019A FY2020A
615
12
2%
33
LO
5
(4)
40
86
86
14%
615
0
0%
34
5
(0)
44
83
1
84
14%
CHURCHILL
CAPITAL VII
FY2021A FY2022A FY2023E
722
22
3%
33
14
0
49
117
1
118
16%
826
25
3%
36
9
54
124
2
1
1
129
CorpAcq
16%
951
35
4%
48
11
58
152
1
152
16%
Source: CorpAcq Management.
Note: Financial information based on UK GAAP audits and has not been audited in accordance with PCAOB standards. FY2023E financials are estimates from CorpAcq Management. Assumes USD:GBP exchange ratio of 1.286:1. (1) Net
income margin is defined as net income / revenue. (2) Adjusted EBITDA is earnings before interest, taxes, depreciation and amortization adding back any one-time costs related to previous capital raises and share-based deferred compensation.
(3) Adjusted EBITDA Margin is defined as Adj. EBITDA/ revenue.
43View entire presentation