Confluent Investor Presentation Deck
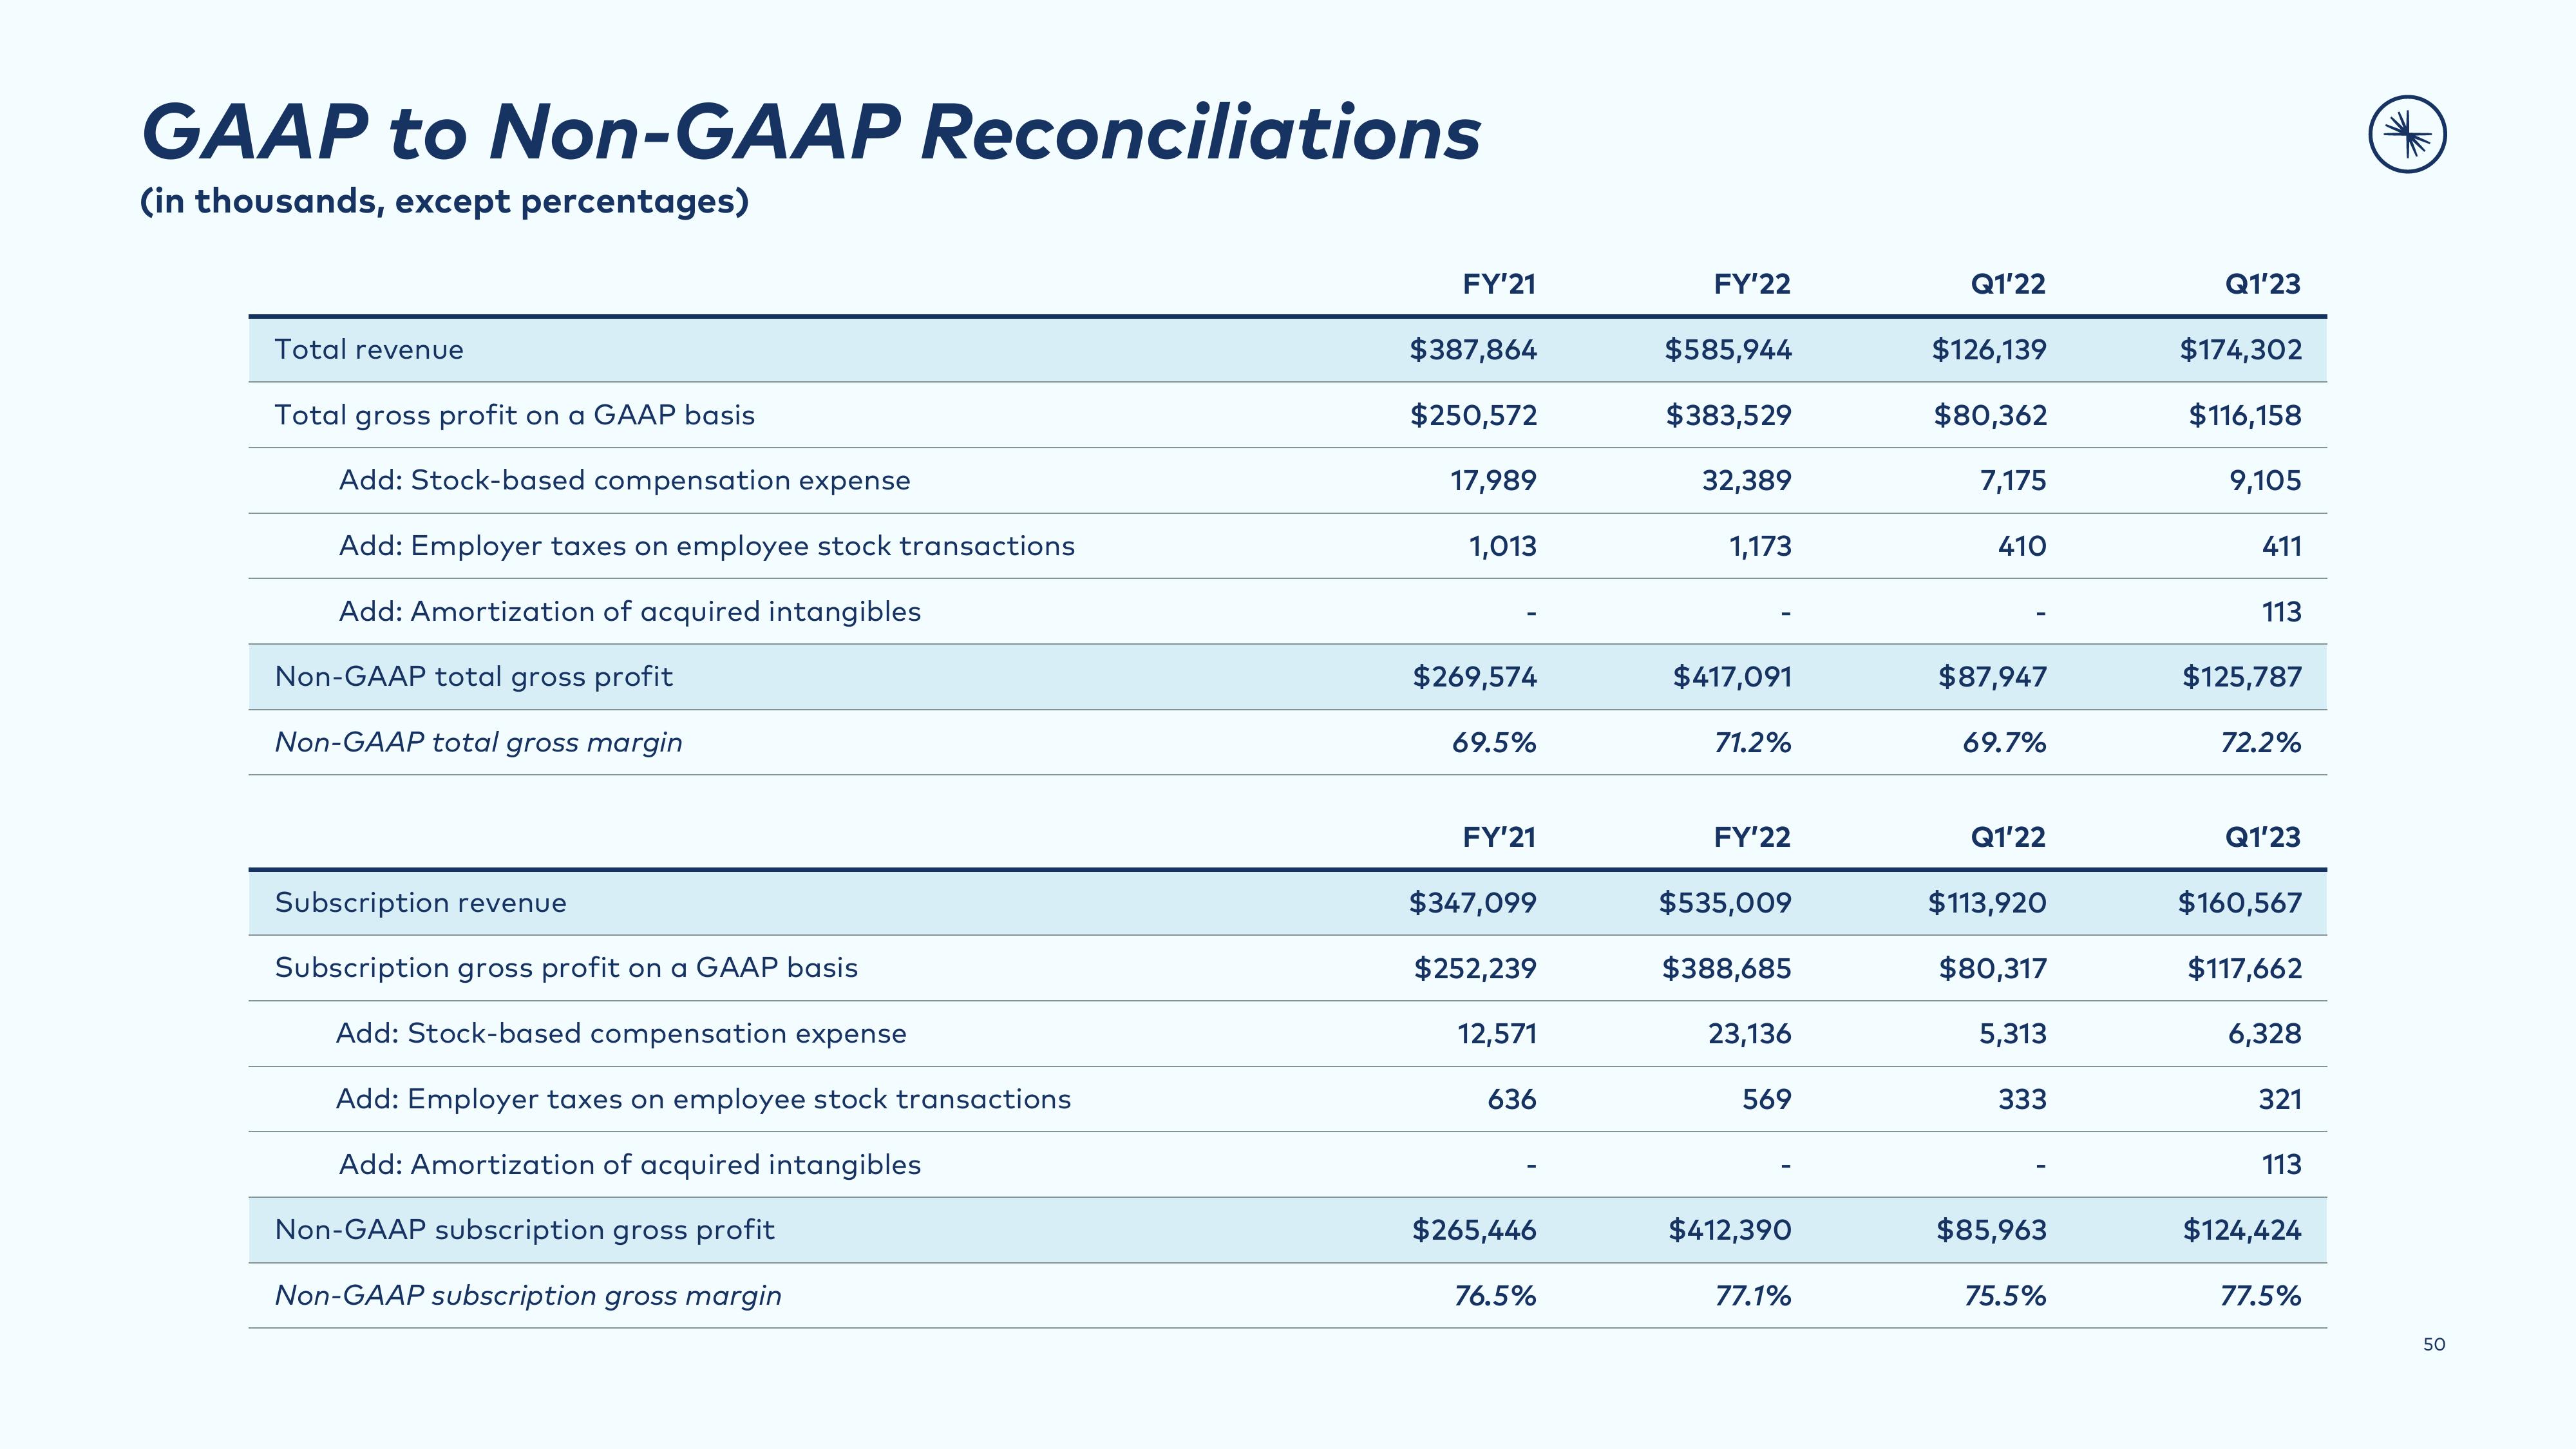
GAAP to Non-GAAP Reconciliations
(in thousands, except percentages)
Total revenue
Total gross profit on a GAAP basis
Add: Stock-based compensation expense
Add: Employer taxes on employee stock transactions
Add: Amortization of acquired intangibles
Non-GAAP total gross profit
Non-GAAP total gross margin
Subscription revenue
Subscription gross profit on a GAAP basis
Add: Stock-based compensation expense
Add: Employer taxes on employee stock transactions
Add: Amortization of acquired intangibles
Non-GAAP subscription gross profit
Non-GAAP subscription gross margin
FY'21
$387,864
$250,572
17,989
1,013
$269,574
69.5%
FY'21
$347,099
$252,239
12,571
636
$265,446
76.5%
FY'22
$585,944
$383,529
32,389
1,173
$417,091
71.2%
FY'22
$535,009
$388,685
23,136
569
$412,390
77.1%
Q1'22
$126,139
$80,362
7,175
410
$87,947
69.7%
Q1'22
$113,920
$80,317
5,313
333
$85,963
75.5%
Q1'23
$174,302
$116,158
9,105
411
113
$125,787
72.2%
Q1'23
$160,567
$117,662
6,328
321
113
$124,424
77.5%
AN
50View entire presentation