First Busey Results Presentation Deck
1.
2.
4Q23 Earnings Investor Presentation
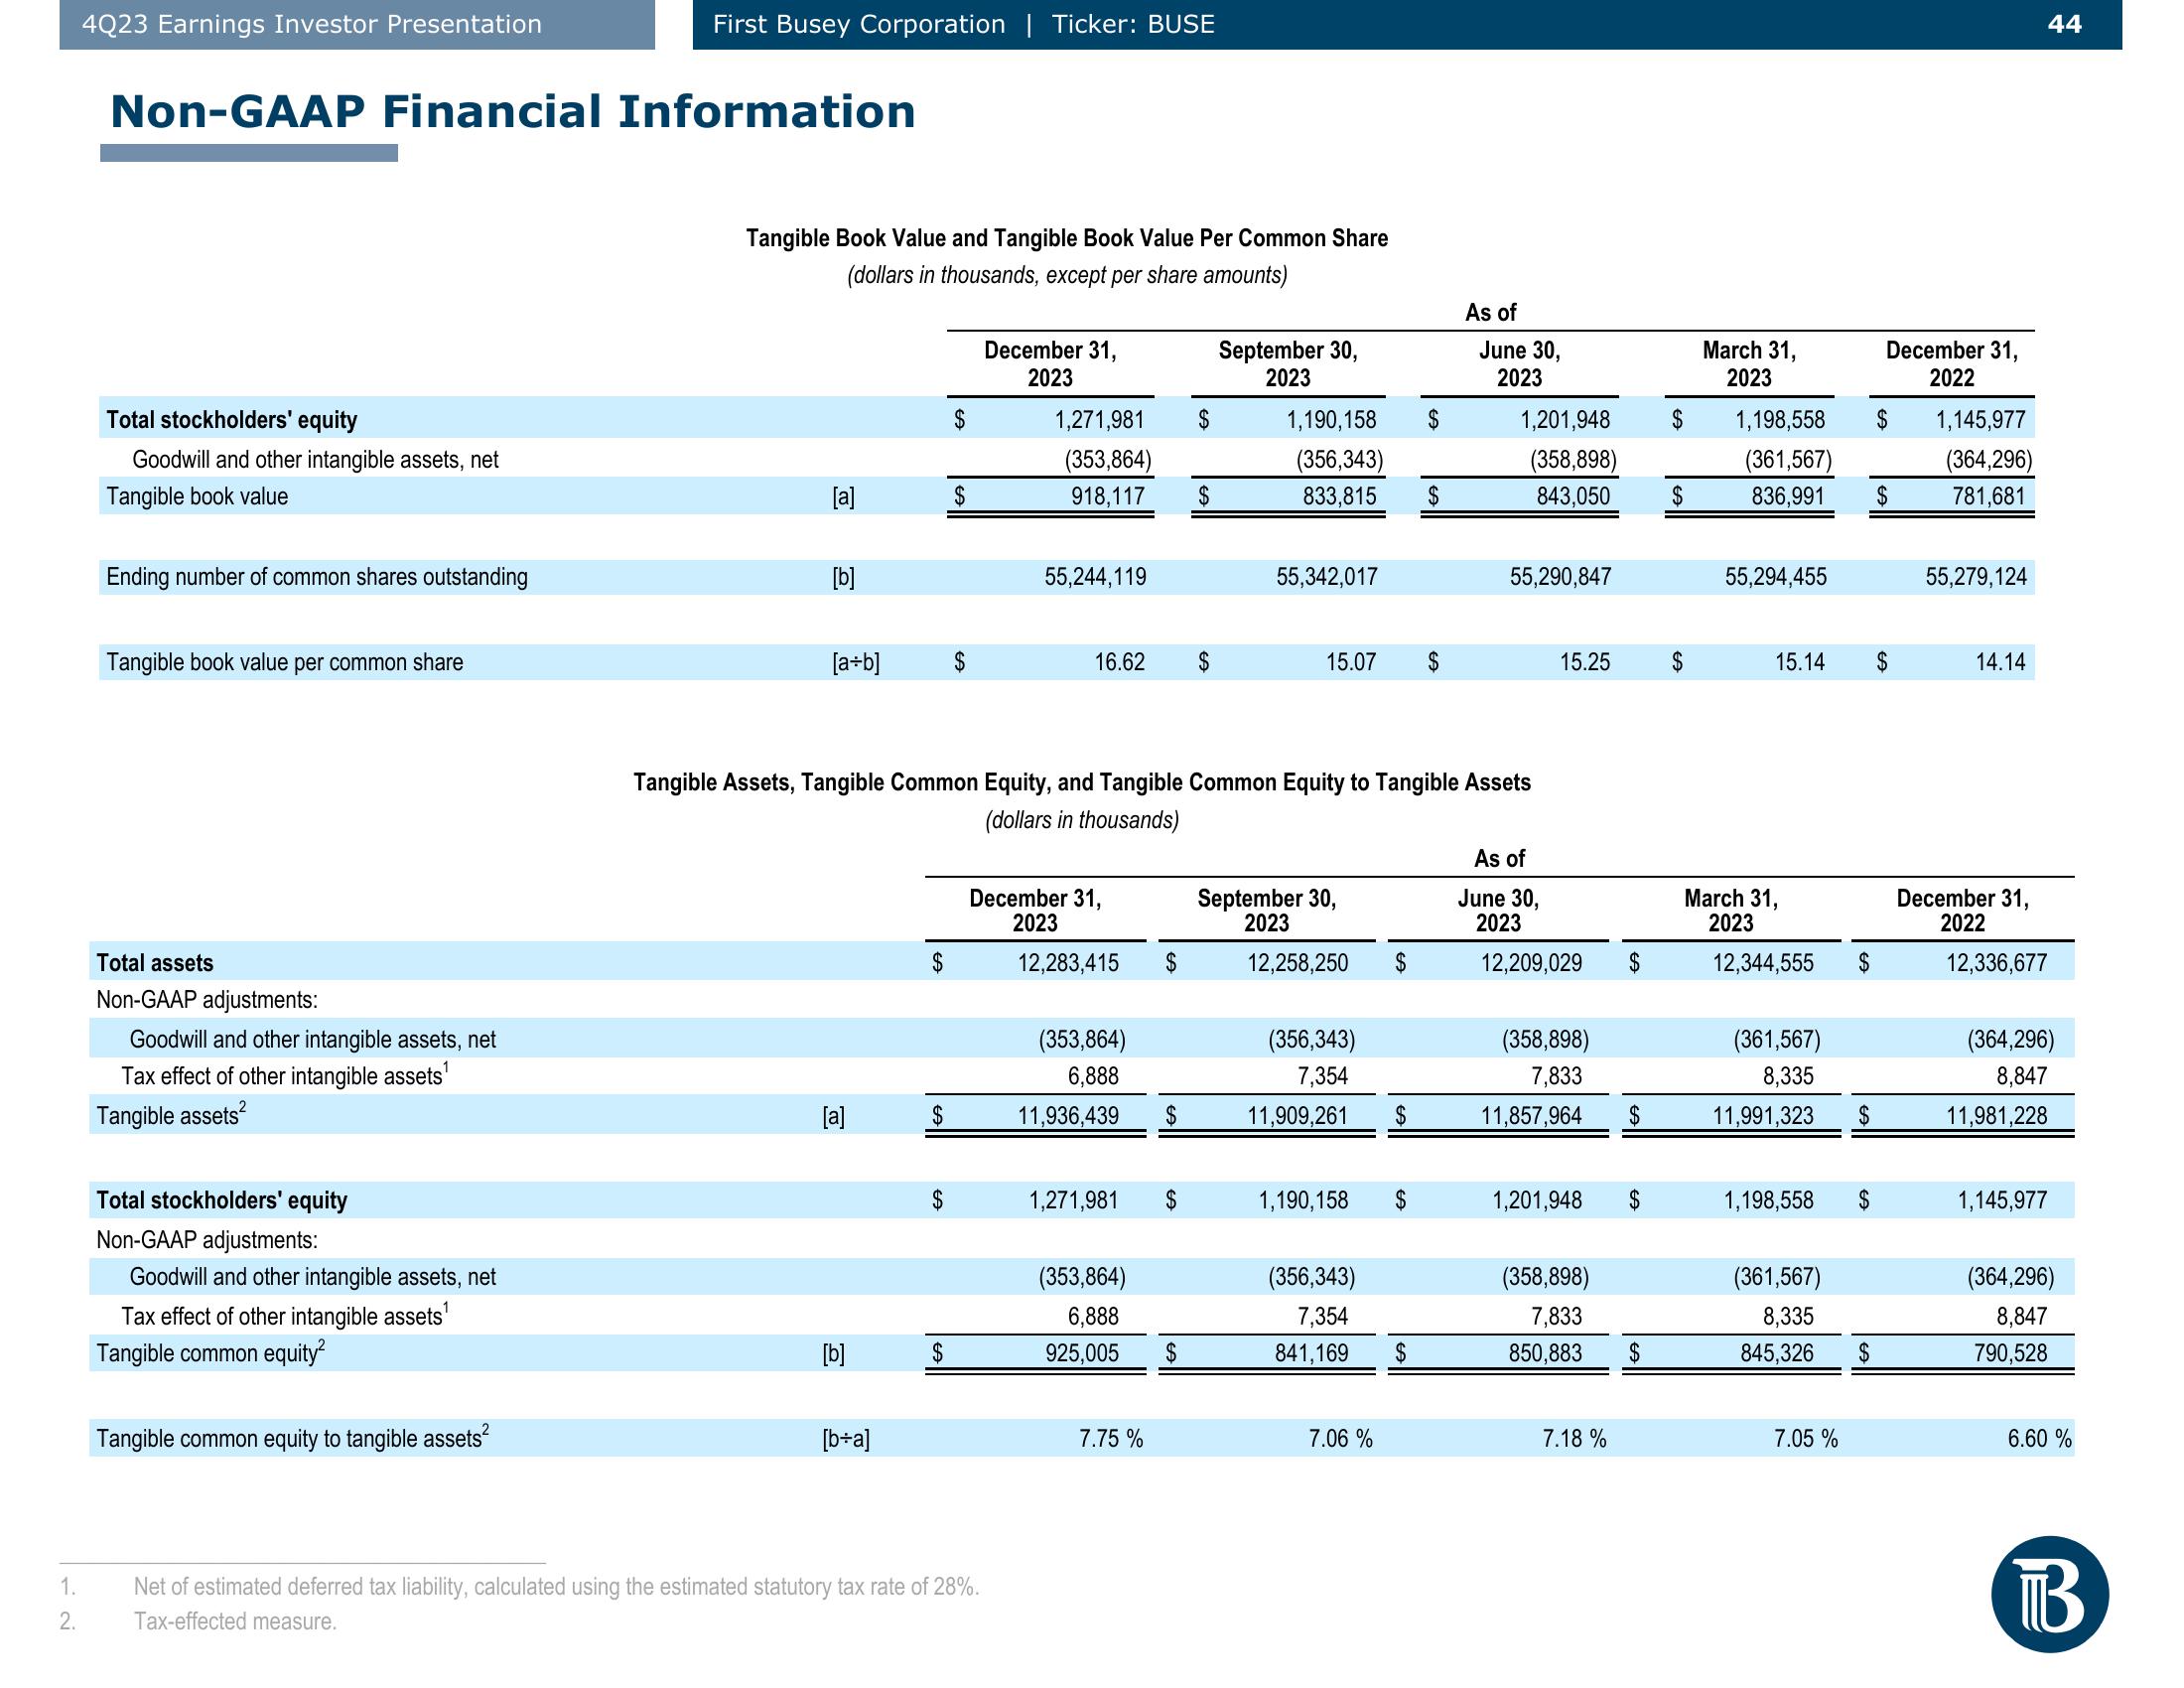
Non-GAAP Financial Information
Total stockholders' equity
Goodwill other intangible assets, net
Tangible book value
Ending number of common shares outstanding
Tangible book value per common share
Total assets
Non-GAAP adjustments:
Goodwill and other intangible assets, net
Tax effect of other intangible assets¹
Tangible assets²
Total stockholders' equity
Non-GAAP adjustments:
Goodwill and other intangible assets, net
Tax effect of other intangible assets¹
Tangible common equity²
First Busey Corporation | Ticker: BUSE
Tangible common equity to tangible assets
Tangible Book Value and Tangible Book Value Per Common Share
(dollars in thousands, except per share amounts)
[a]
[b]
[a+b]
[a]
[b]
[b+a]
$
$
$
$
$
December 31,
2023
1,271,981
(353,864)
918,117 $
Net of estimated deferred tax liability, calculated using the estimated statutory tax rate of 28%.
Tax-effected measure.
55,244,119
16.62 $
December 31,
2023
12,283,415
Tangible Assets, Tangible Common Equity, and Tangible Common Equity to Tangible Assets
(dollars in thousands)
(353,864)
6,888
11,936,439
(353,864)
6,888
925,005
$
1,271,981 $
7.75%
$
$
$
September 30,
2023
1,190,158 $
(356,343)
833,815
55,342,017
15.07 $
September 30,
2023
12,258,250
(356,343)
7,354
11,909,261
(356,343)
7,354
841,169
$
1,190,158 $
7.06 %
$
$
$
As of
June 30,
2023
1,201,948
(358,898)
843,050
55,290,847
As of
June 30,
2023
15.25
12,209,029
(358,898)
7,833
11,857,964
1,201,948
(358,898)
7,833
850,883
7.18 %
$
$
$
$
$
$
$
March 31,
2023
1,198,558
(361,567)
836,991
55,294,455
15.14
March 31,
2023
12,344,555
(361,567)
8,335
11,991,323 $
1,198,558
(361,567)
8,335
845,326
$
7.05%
$
$
December 31,
2022
$
$
1,145,977
(364,296)
781,681
55,279,124
14.14
December 31,
2022
12,336,677
44
(364,296)
8,847
11,981,228
1,145,977
(364,296)
8,847
790,528
6.60 %
BView entire presentation