View SPAC Presentation Deck
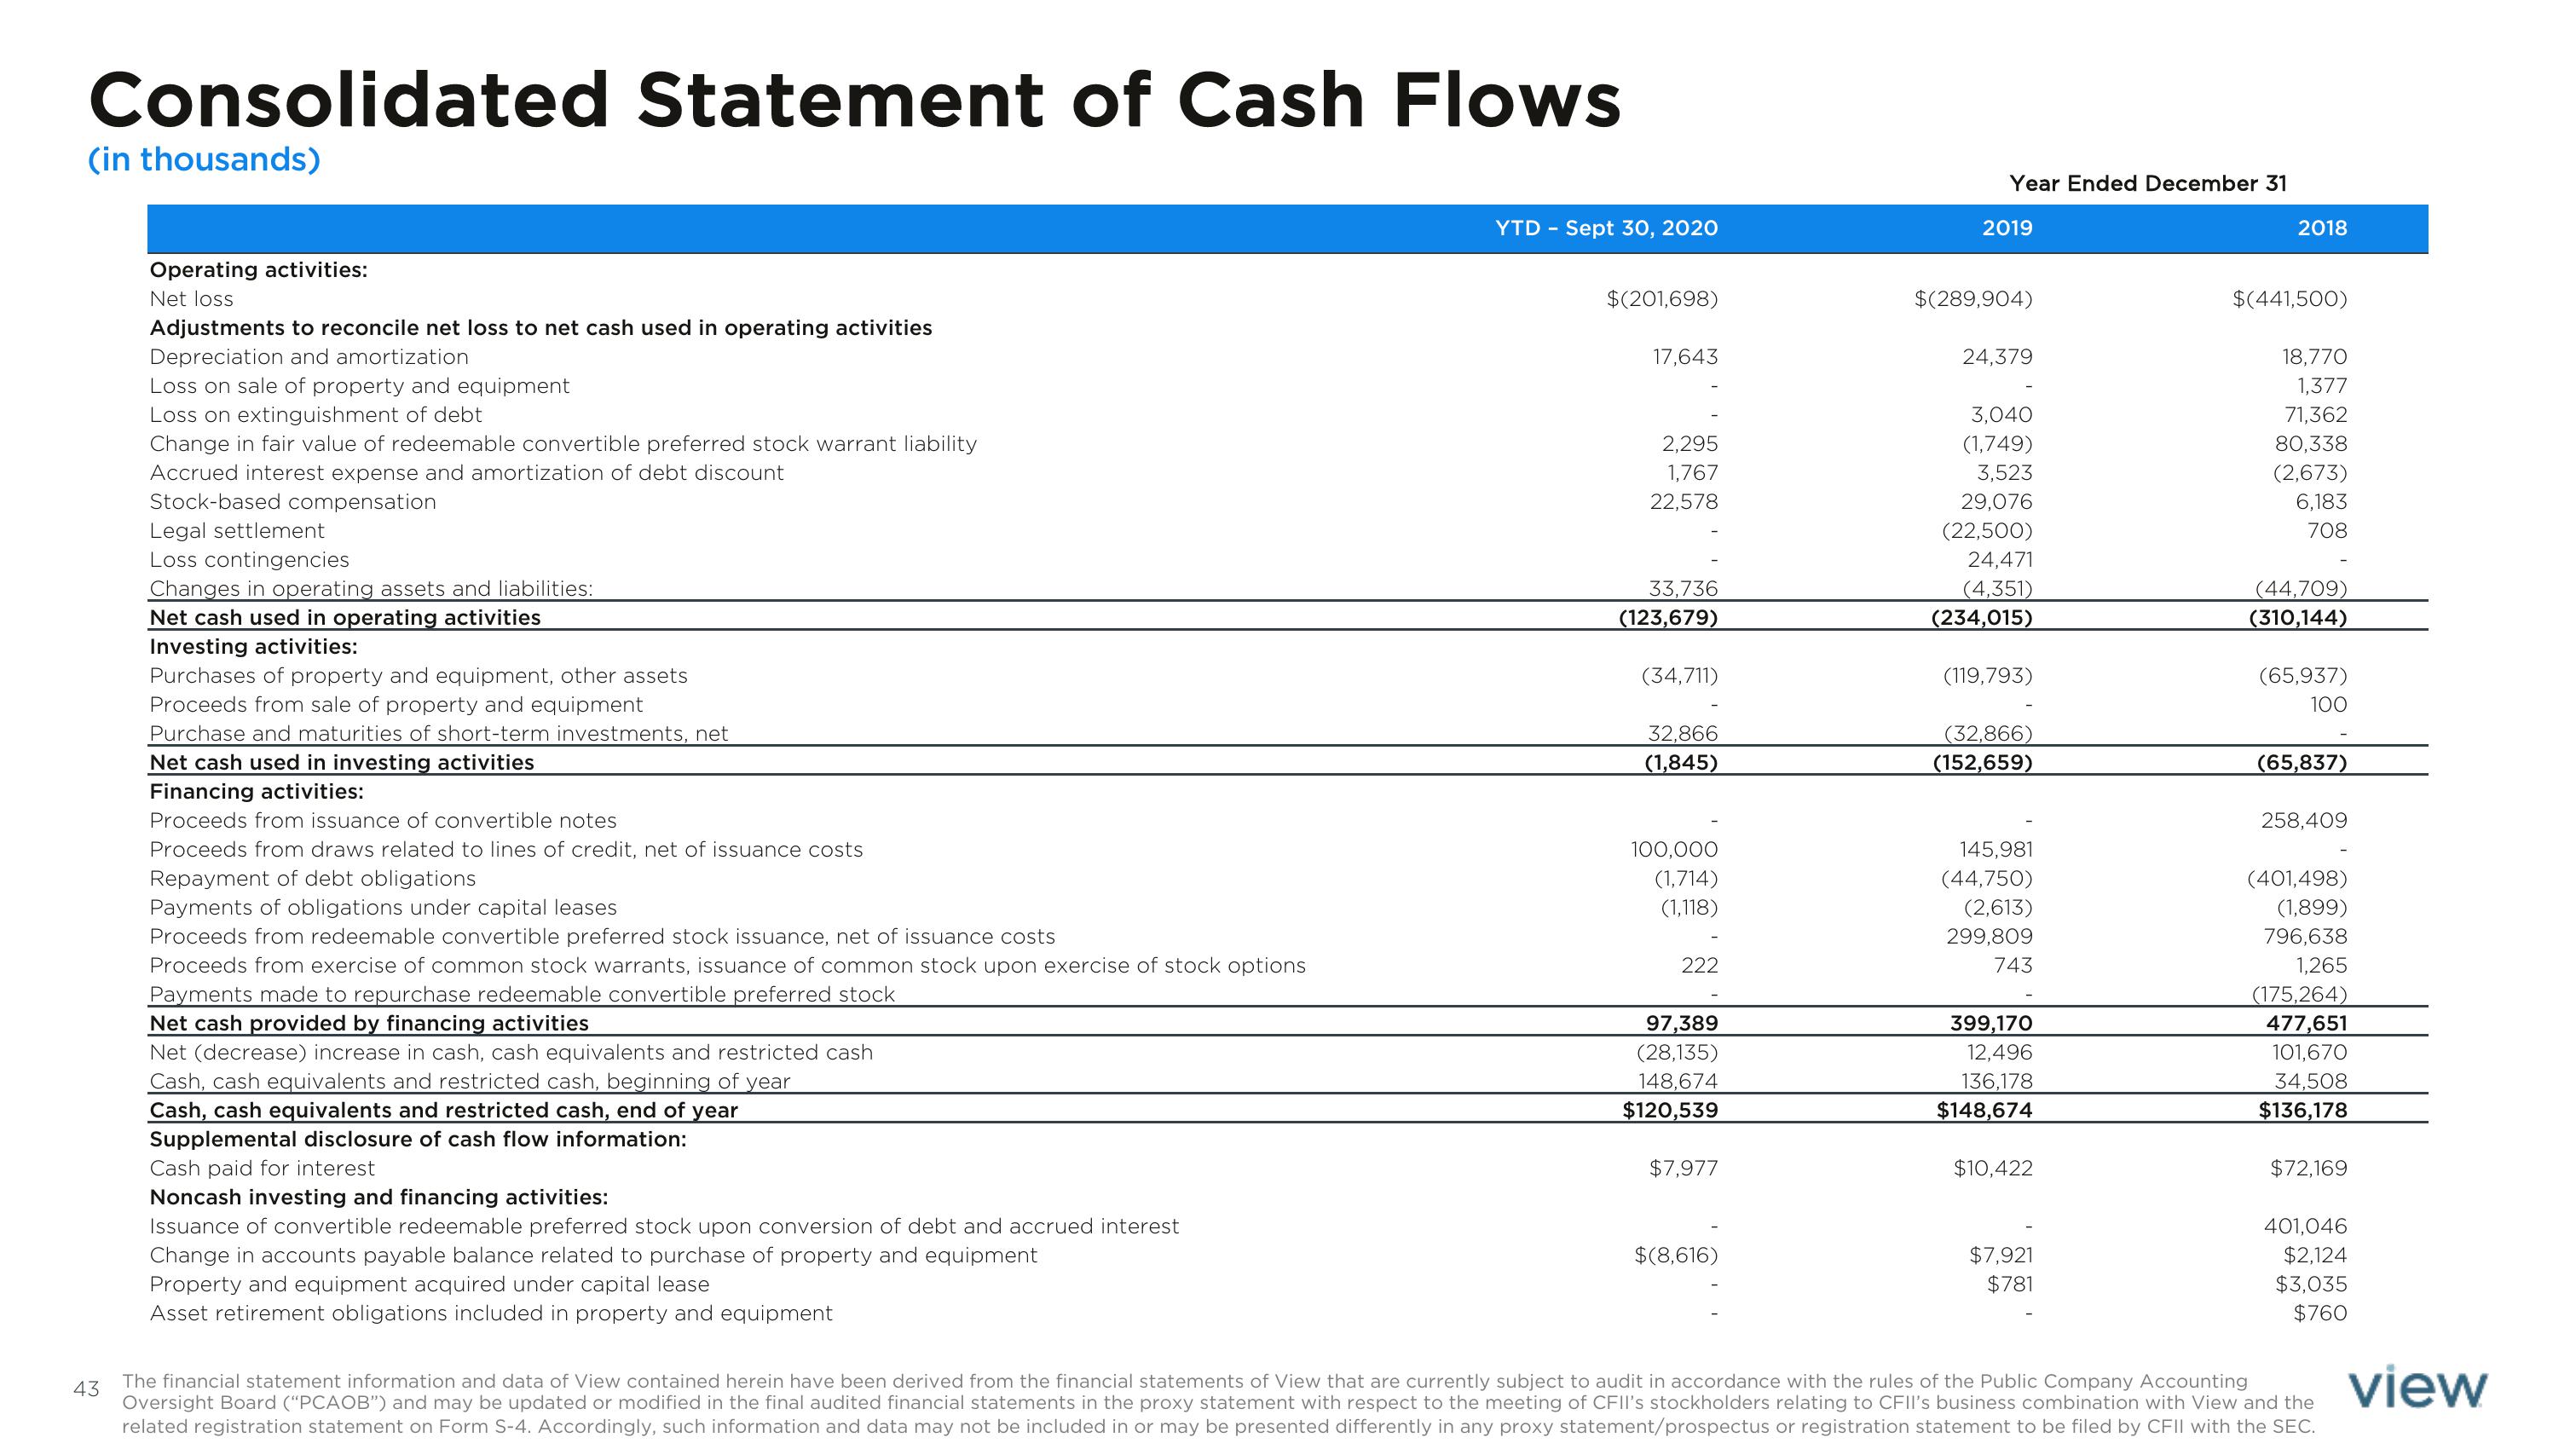
Consolidated Statement of Cash Flows
(in thousands)
43
Operating activities:
Net loss
Adjustments to reconcile net loss to net cash used in operating activities
Depreciation and amortization
Loss on sale of property and equipment
Loss on extinguishment of debt
Change in fair value of redeemable convertible preferred stock warrant liability
Accrued interest expense and amortization of debt discount
Stock-based compensation
Legal settlement
Loss contingencies
Changes in operating assets and liabilities:
Net cash used in operating activities
Investing activities:
Purchases of property and equipment, other assets
Proceeds from sale of property and equipment
Purchase and maturities of short-term investments, net
Net cash used in investing activities
Financing activities:
Proceeds from issuance of convertible notes
Proceeds from draws related to lines of credit, net of issuance costs
Repayment of debt obligations
Payments of obligations under capital leases
Proceeds from redeemable convertible preferred stock issuance, net of issuance costs
Proceeds from exercise of common stock warrants, issuance of common stock upon exercise of stock options
Payments made to repurchase redeemable convertible preferred stock
Net cash provided by financing activities
Net (decrease) increase in cash, cash equivalents and restricted cash
Cash, cash equivalents and restricted cash, beginning of year
Cash, cash equivalents and restricted cash, end of year
Supplemental disclosure of cash flow information:
Cash paid for interest
Noncash investing and financing activities:
Issuance of convertible redeemable preferred stock upon conversion of debt and accrued interest
Change in accounts payable balance related to purchase of property and equipment
Property and equipment acquired under capital lease
Asset retirement obligations included in property and equipment
YTD - Sept 30, 2020
$(201,698)
17,643
2,295
1,767
22,578
33,736
(123,679)
(34,711)
32,866
(1,845)
100,000
(1,714)
(1,118)
222
97,389
(28,135)
148,674
$120,539
$7,977
$(8,616)
Year Ended December 31
2019
$(289,904)
24,379
3,040
(1,749)
3,523
29,076
(22,500)
24,471
(4,351)
(234,015)
(119,793)
(32,866)
(152,659)
145,981
(44,750)
(2,613)
299,809
743
399,170
12,496
136,178
$148,674
$10,422
$7,921
$781
2018
$(441,500)
18,770
1,377
71,362
80,338
(2,673)
6,183
708
(44,709)
(310,144)
(65,937)
100
(65,837)
258,409
(401,498)
(1,899)
796,638
1,265
(175,264)
477,651
101,670
34,508
$136,178
$72,169
401,046
$2,124
$3,035
$760
The financial statement information and data of View contained herein have been derived from the financial statements of View that are currently subject to audit in accordance with the rules of the Public Company Accounting
Oversight Board ("PCAOB") and may be updated or modified in the final audited financial statements in the proxy statement with respect to the meeting of CFII's stockholders relating to CFII's business combination with View and the
related registration statement on Form S-4. Accordingly, such information and data may not be included in or may be presented differently in any proxy statement/prospectus or registration statement to be filed by CFII with the SEC.
viewView entire presentation