Ashtead Group Results Presentation Deck
US TRADING
General tool
Specialty
Total
May
Q1
Jun
Q2
1 Rental only revenue presented on a billing day basis
Jul
FY22
Aug
Q3
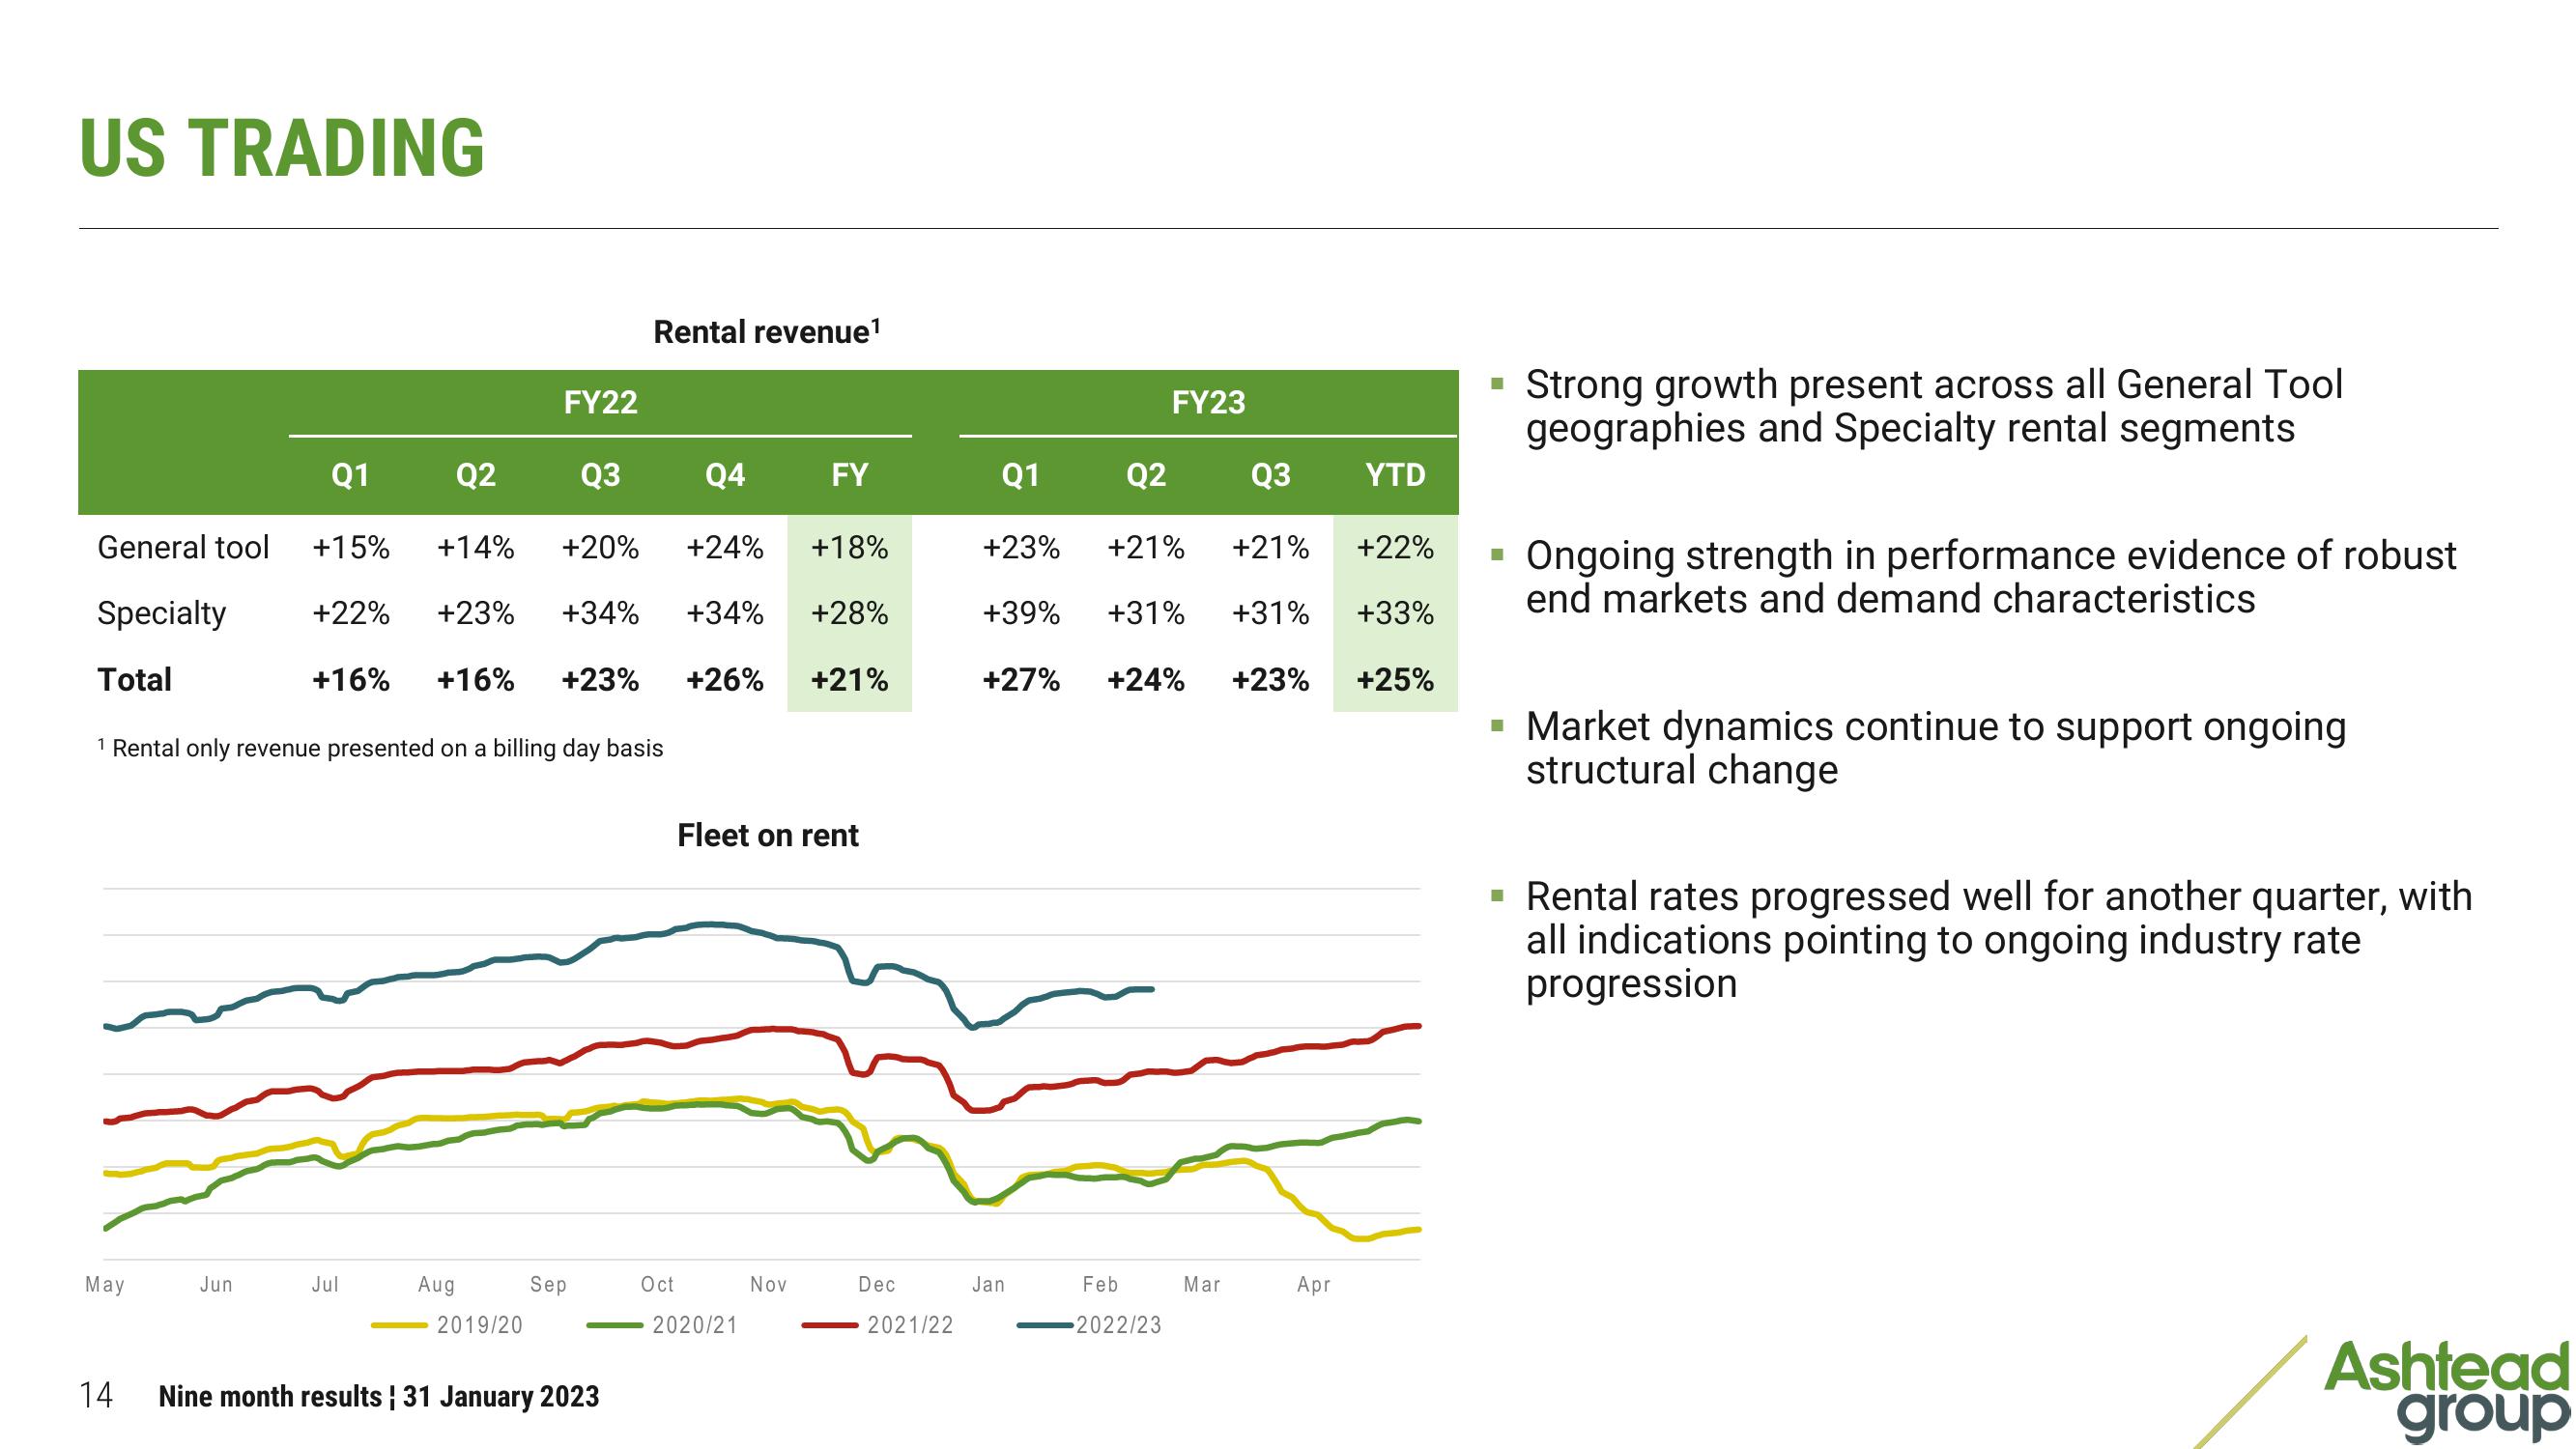
+15% +14% +20%
+24%
+18%
+22% +23% +34%
+34% +28%
+16% +16% +23% +26% +21%
2019/20
Rental revenue¹
Sep
14 Nine month results ¦ 31 January 2023
Q4
Oct
FY
Fleet on rent
2020/21
Nov
Dec
2021/22
Q1
Q2
Q3
+23% +21% +21%
+22%
+39% +31% +31% +33%
+27% +24% +23% +25%
Jan
FY23
Feb
-2022/23
Mar
Apr
YTD
Strong growth present across all General Tool
geographies and Specialty rental segments
Ongoing strength in performance evidence of robust
end markets and demand characteristics
▪ Market dynamics continue to support ongoing
structural change
▪ Rental rates progressed well for another quarter, with
all indications pointing to ongoing industry rate
progression
Ashtead
groupView entire presentation