Wirecard Results Presentation Deck
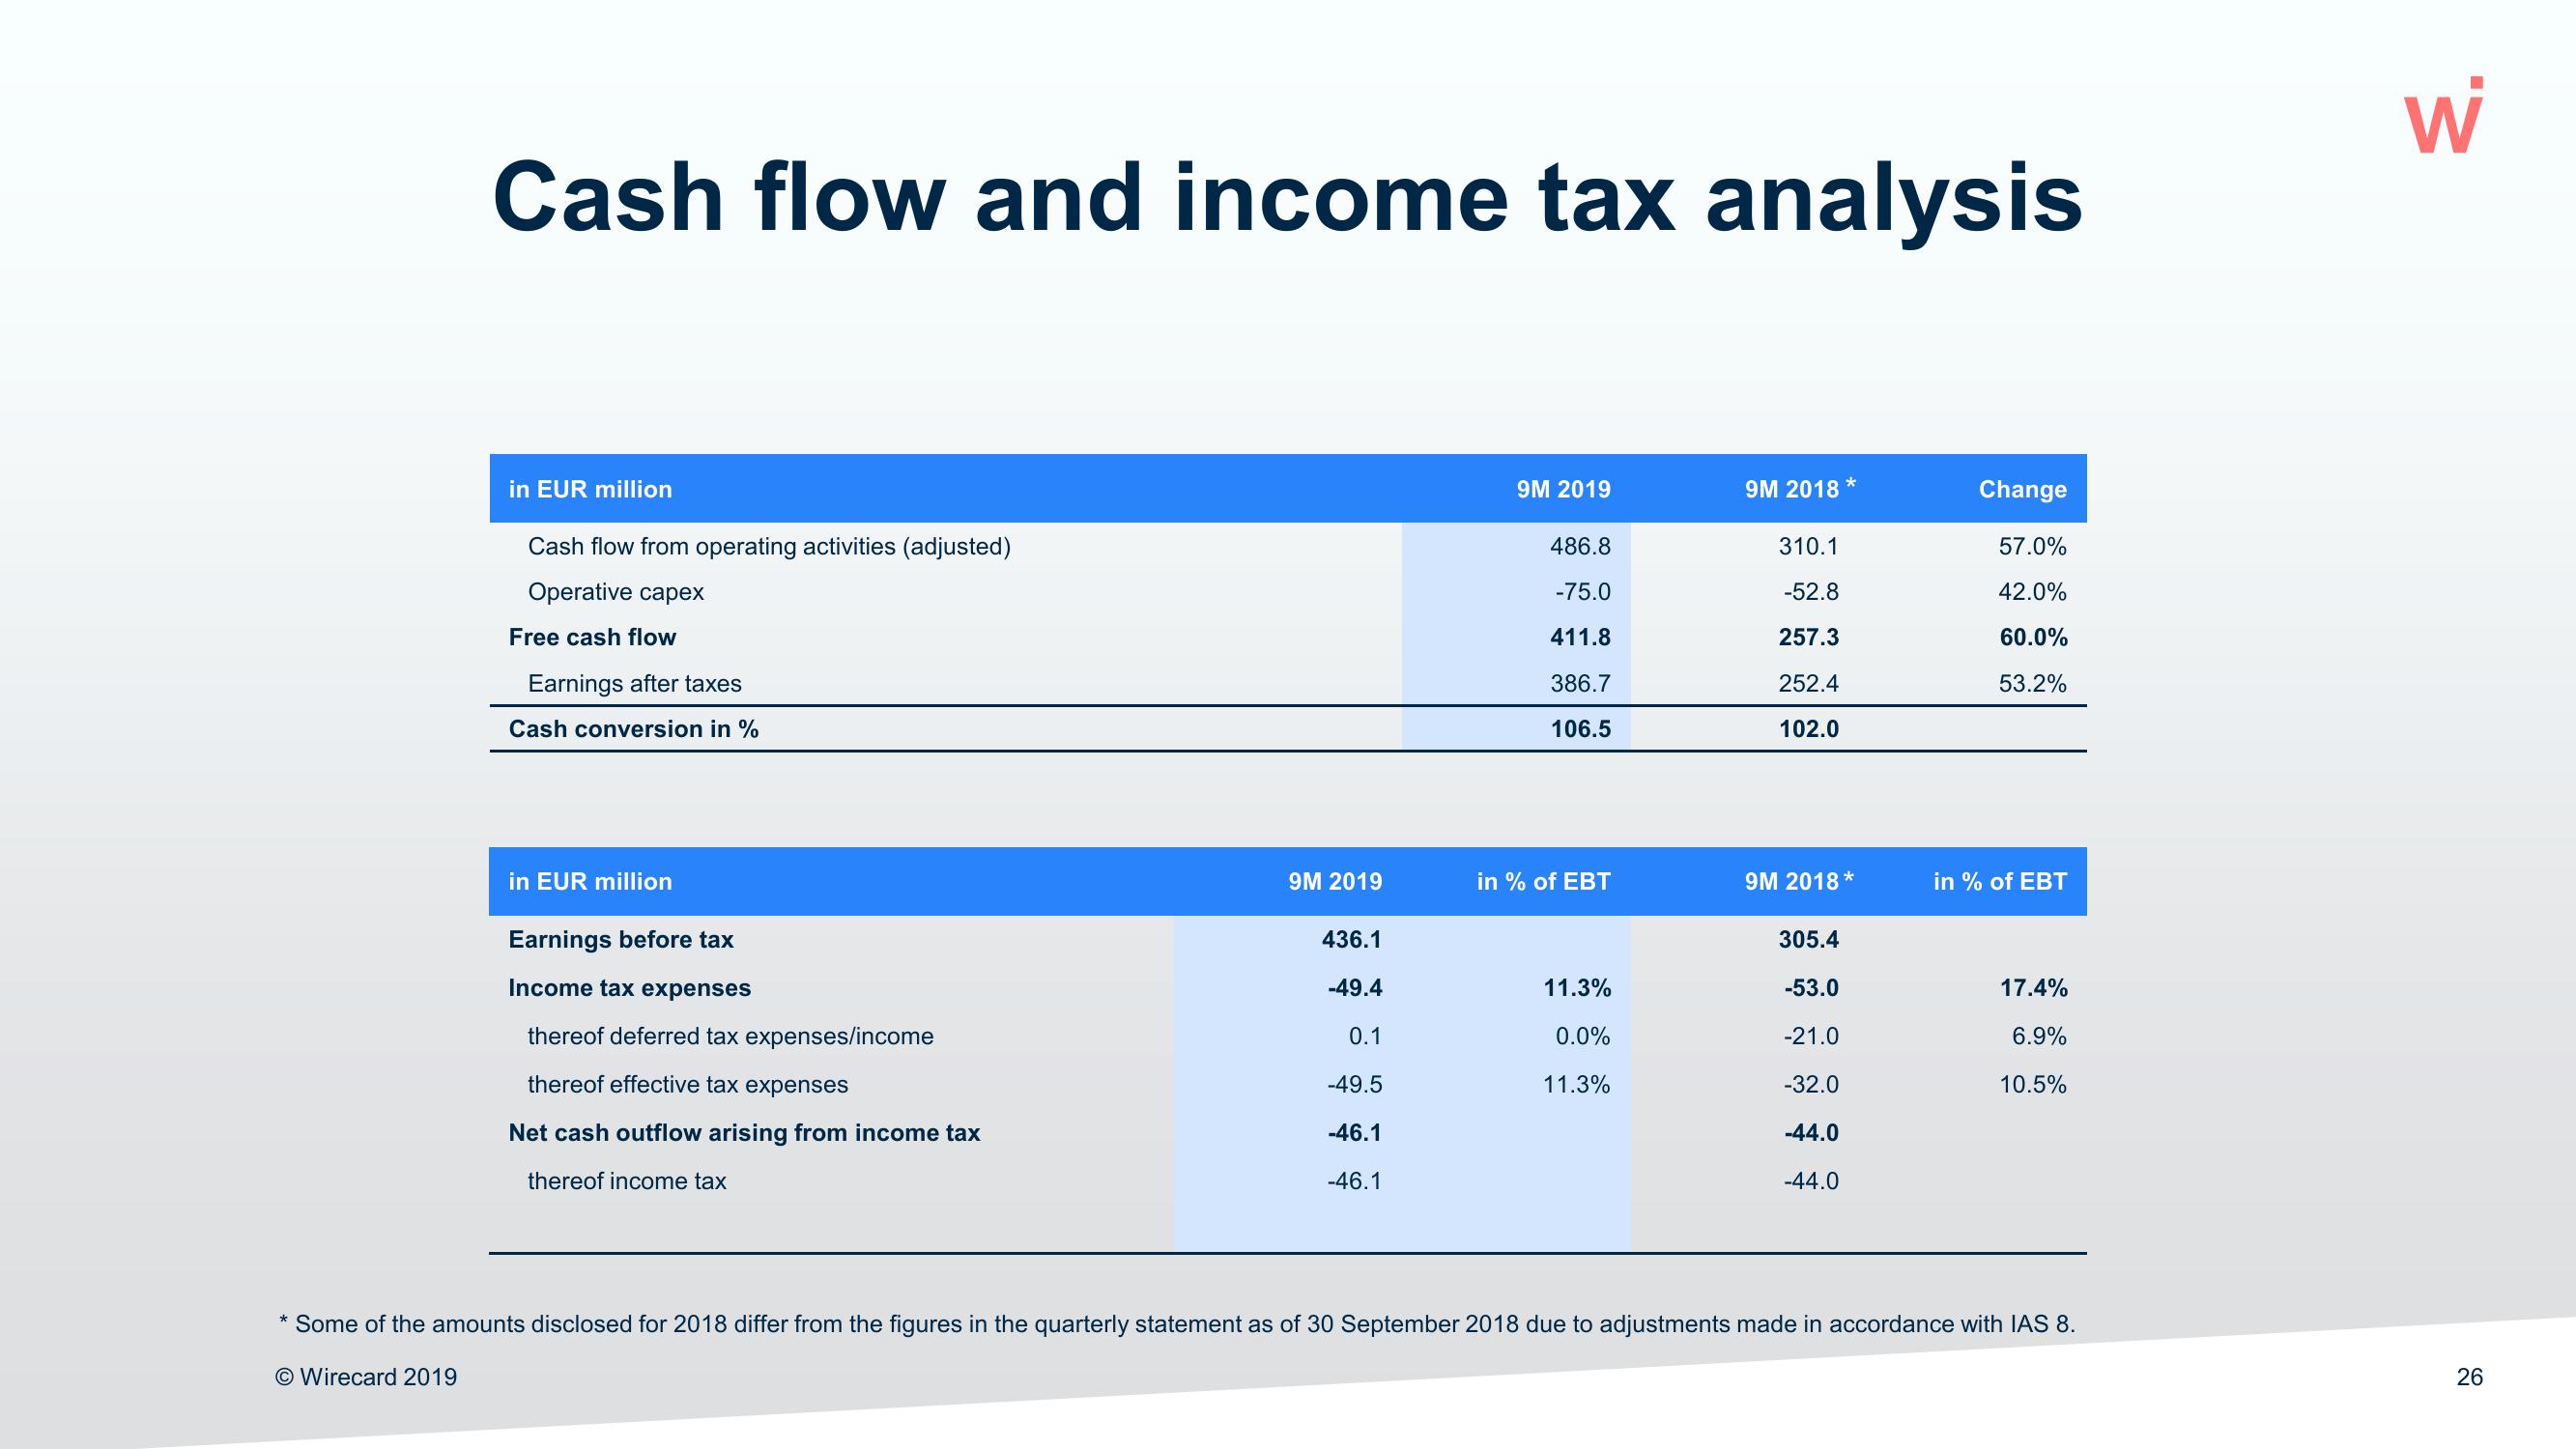
Cash flow and income tax analysis
in EUR million
Cash flow from operating activities (adjusted)
Operative capex
Free cash flow
Earnings after taxes
Cash conversion in %
in EUR million
Earnings before tax
Income tax expenses
thereof deferred tax expenses/income
thereof effective tax expenses
Net cash outflow arising from income tax
thereof income tax
9M 2019
436.1
-49.4
0.1
-49.5
-46.1
-46.1
9M 2019
486.8
-75.0
411.8
386.7
106.5
in % of EBT
11.3%
0.0%
11.3%
9M 2018
310.1
-52.8
257.3
252.4
102.0
*
9M 2018 *
305.4
-53.0
-21.0
-32.0
-44.0
-44.0
Change
57.0%
42.0%
60.0%
53.2%
in % of EBT
17.4%
6.9%
10.5%
* Some of the amounts disclosed for 2018 differ from the figures in the quarterly statement as of 30 September 2018 due to adjustments made in accordance with IAS 8.
O Wirecard 2019
W
26View entire presentation