Commercial Metals Company Results Presentation Deck
Cash Generation Profile
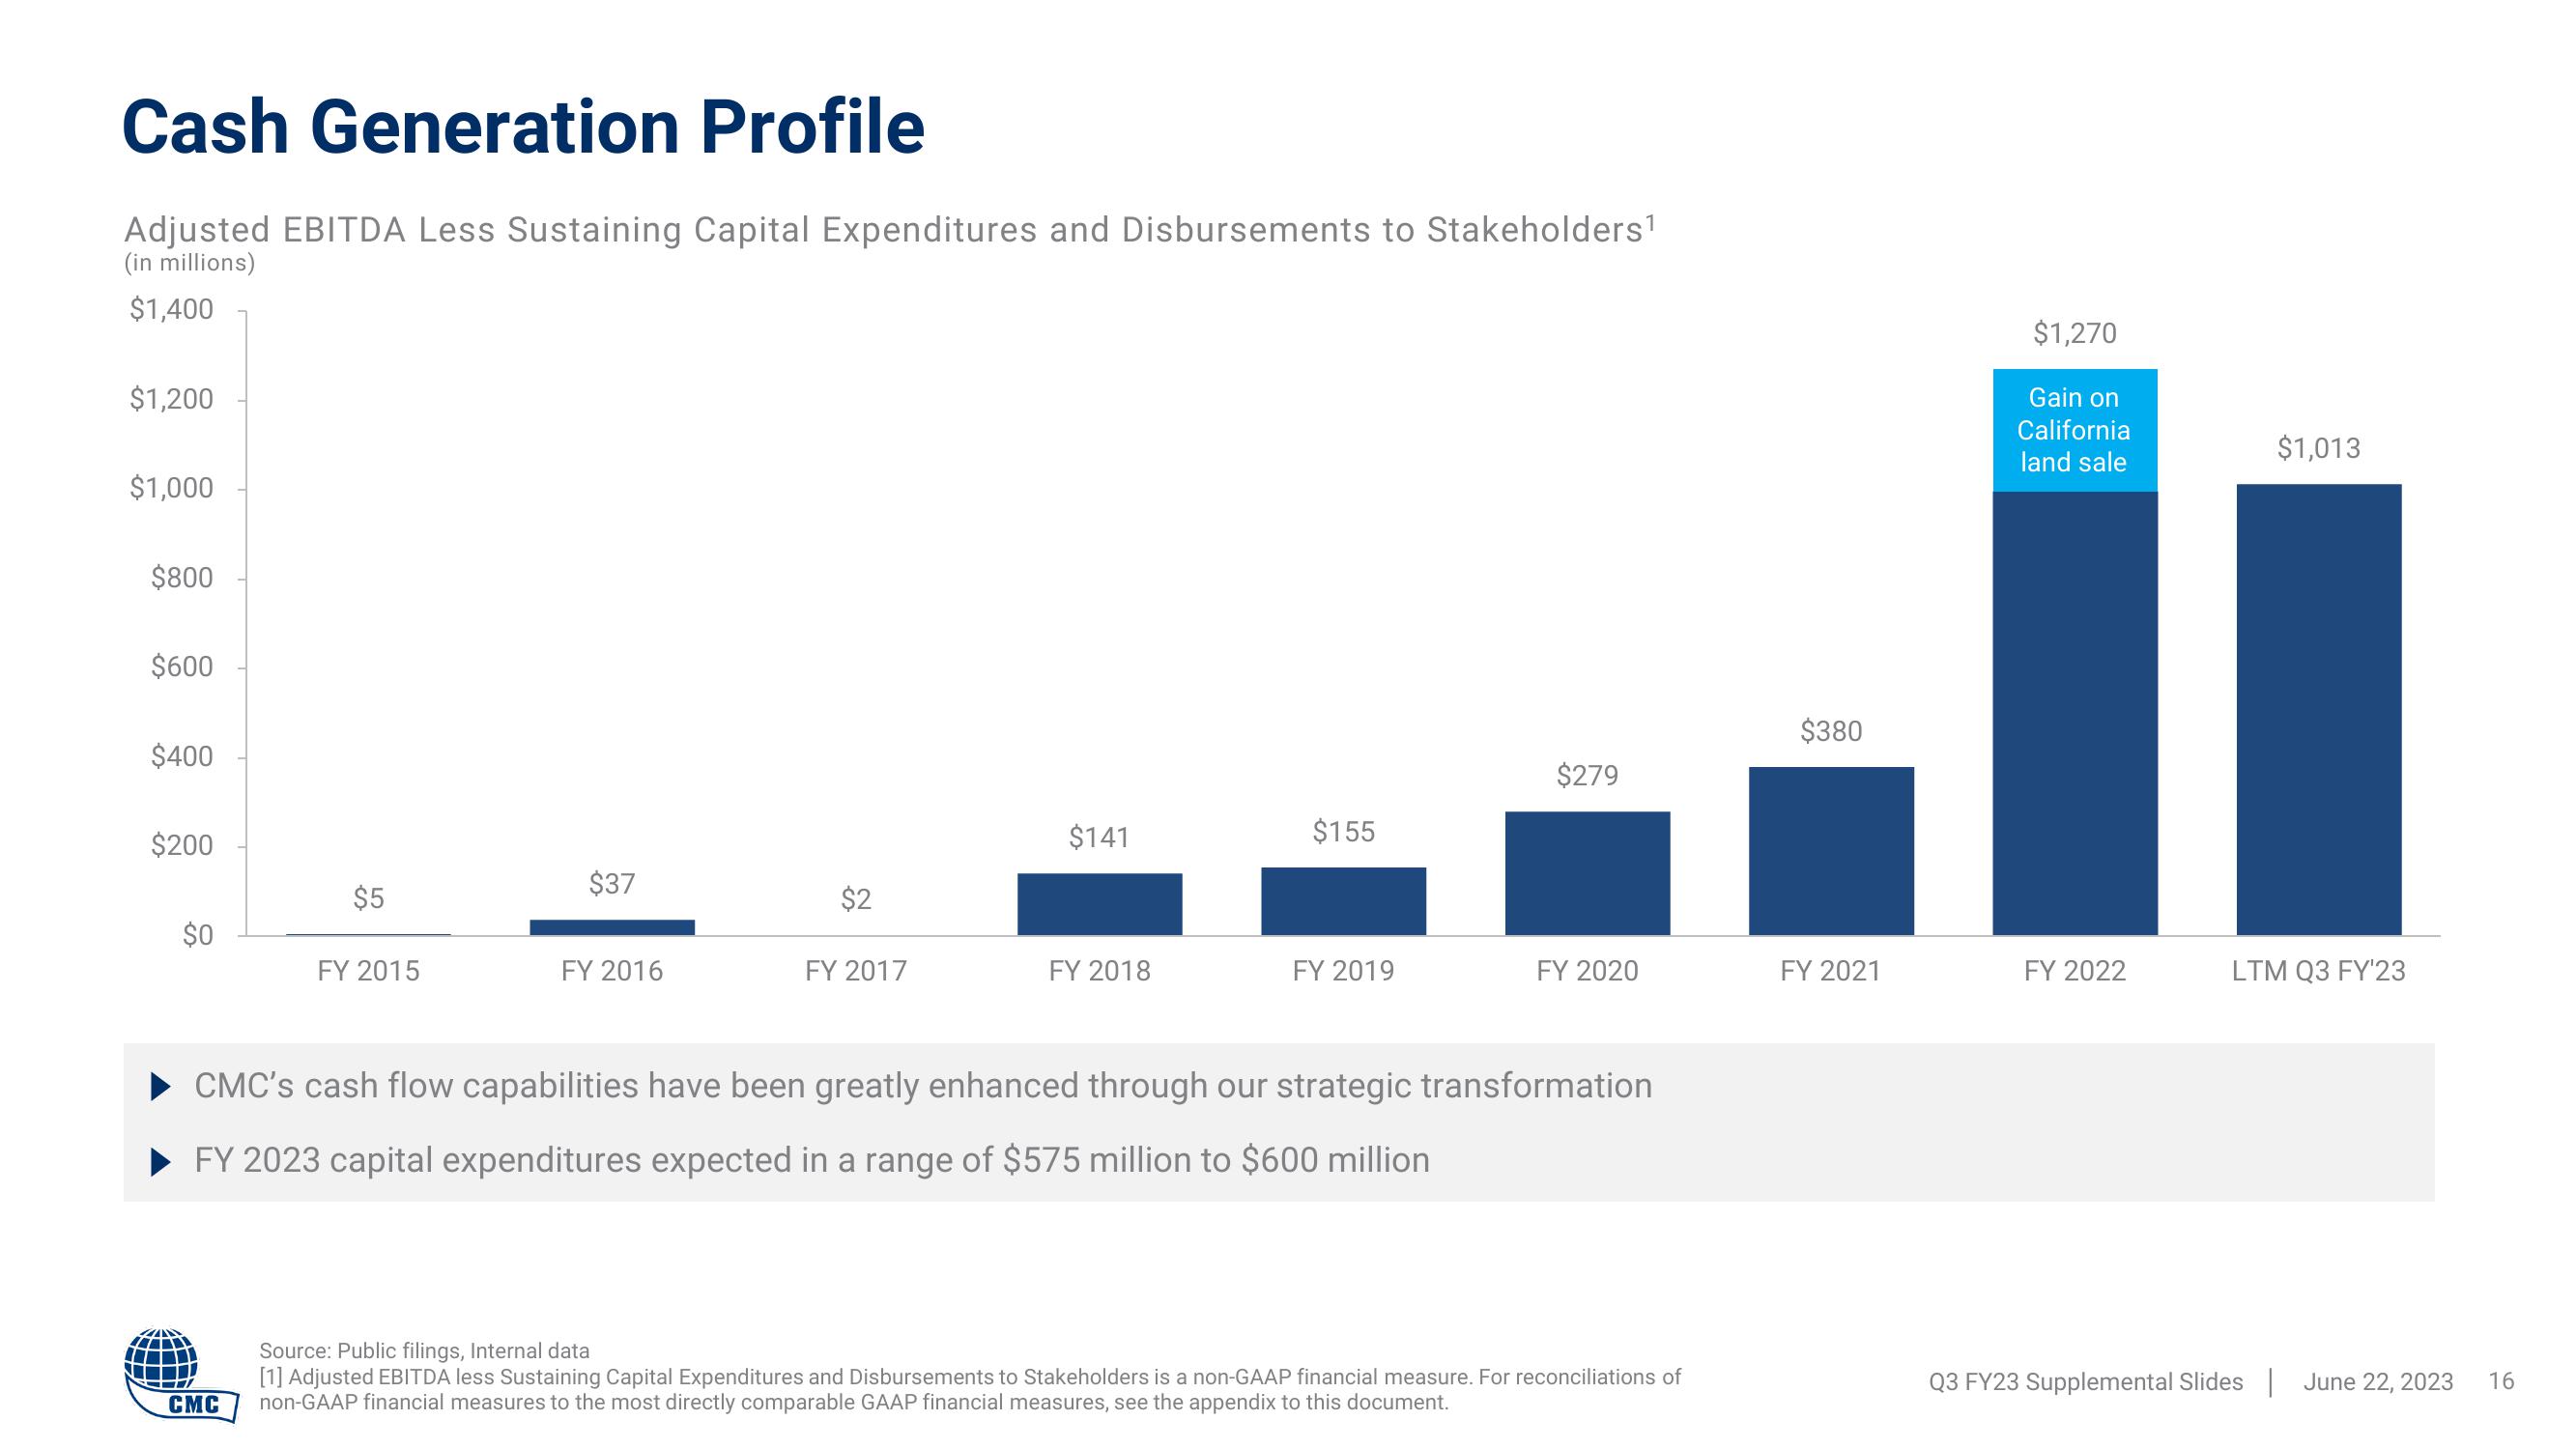
Adjusted EBITDA Less Sustaining Capital Expenditures and Disbursements to Stakeholders¹
(in millions)
$1,400
$1,200
$1,000
$800
$600
$400
$200
$0
$5
CMC
FY 2015
$37
FY 2016
$2
FY 2017
$141
FY 2018
$155
FY 2019
$279
FY 2020
CMC's cash flow capabilities have been greatly enhanced through our strategic transformation
► FY 2023 capital expenditures expected in a range of $575 million to $600 million
Source: Public filings, Internal data
[1] Adjusted EBITDA less Sustaining Capital Expenditures and Disbursements to Stakeholders is a non-GAAP financial measure. For reconciliations of
non-GAAP financial measures to the most directly comparable GAAP financial measures, see the appendix to this document.
$380
FY 2021
$1,270
Gain on
California
land sale
FY 2022
$1,013
LTM Q3 FY'23
Q3 FY23 Supplemental Slides June 22, 2023
16View entire presentation