Nexters SPAC Presentation Deck
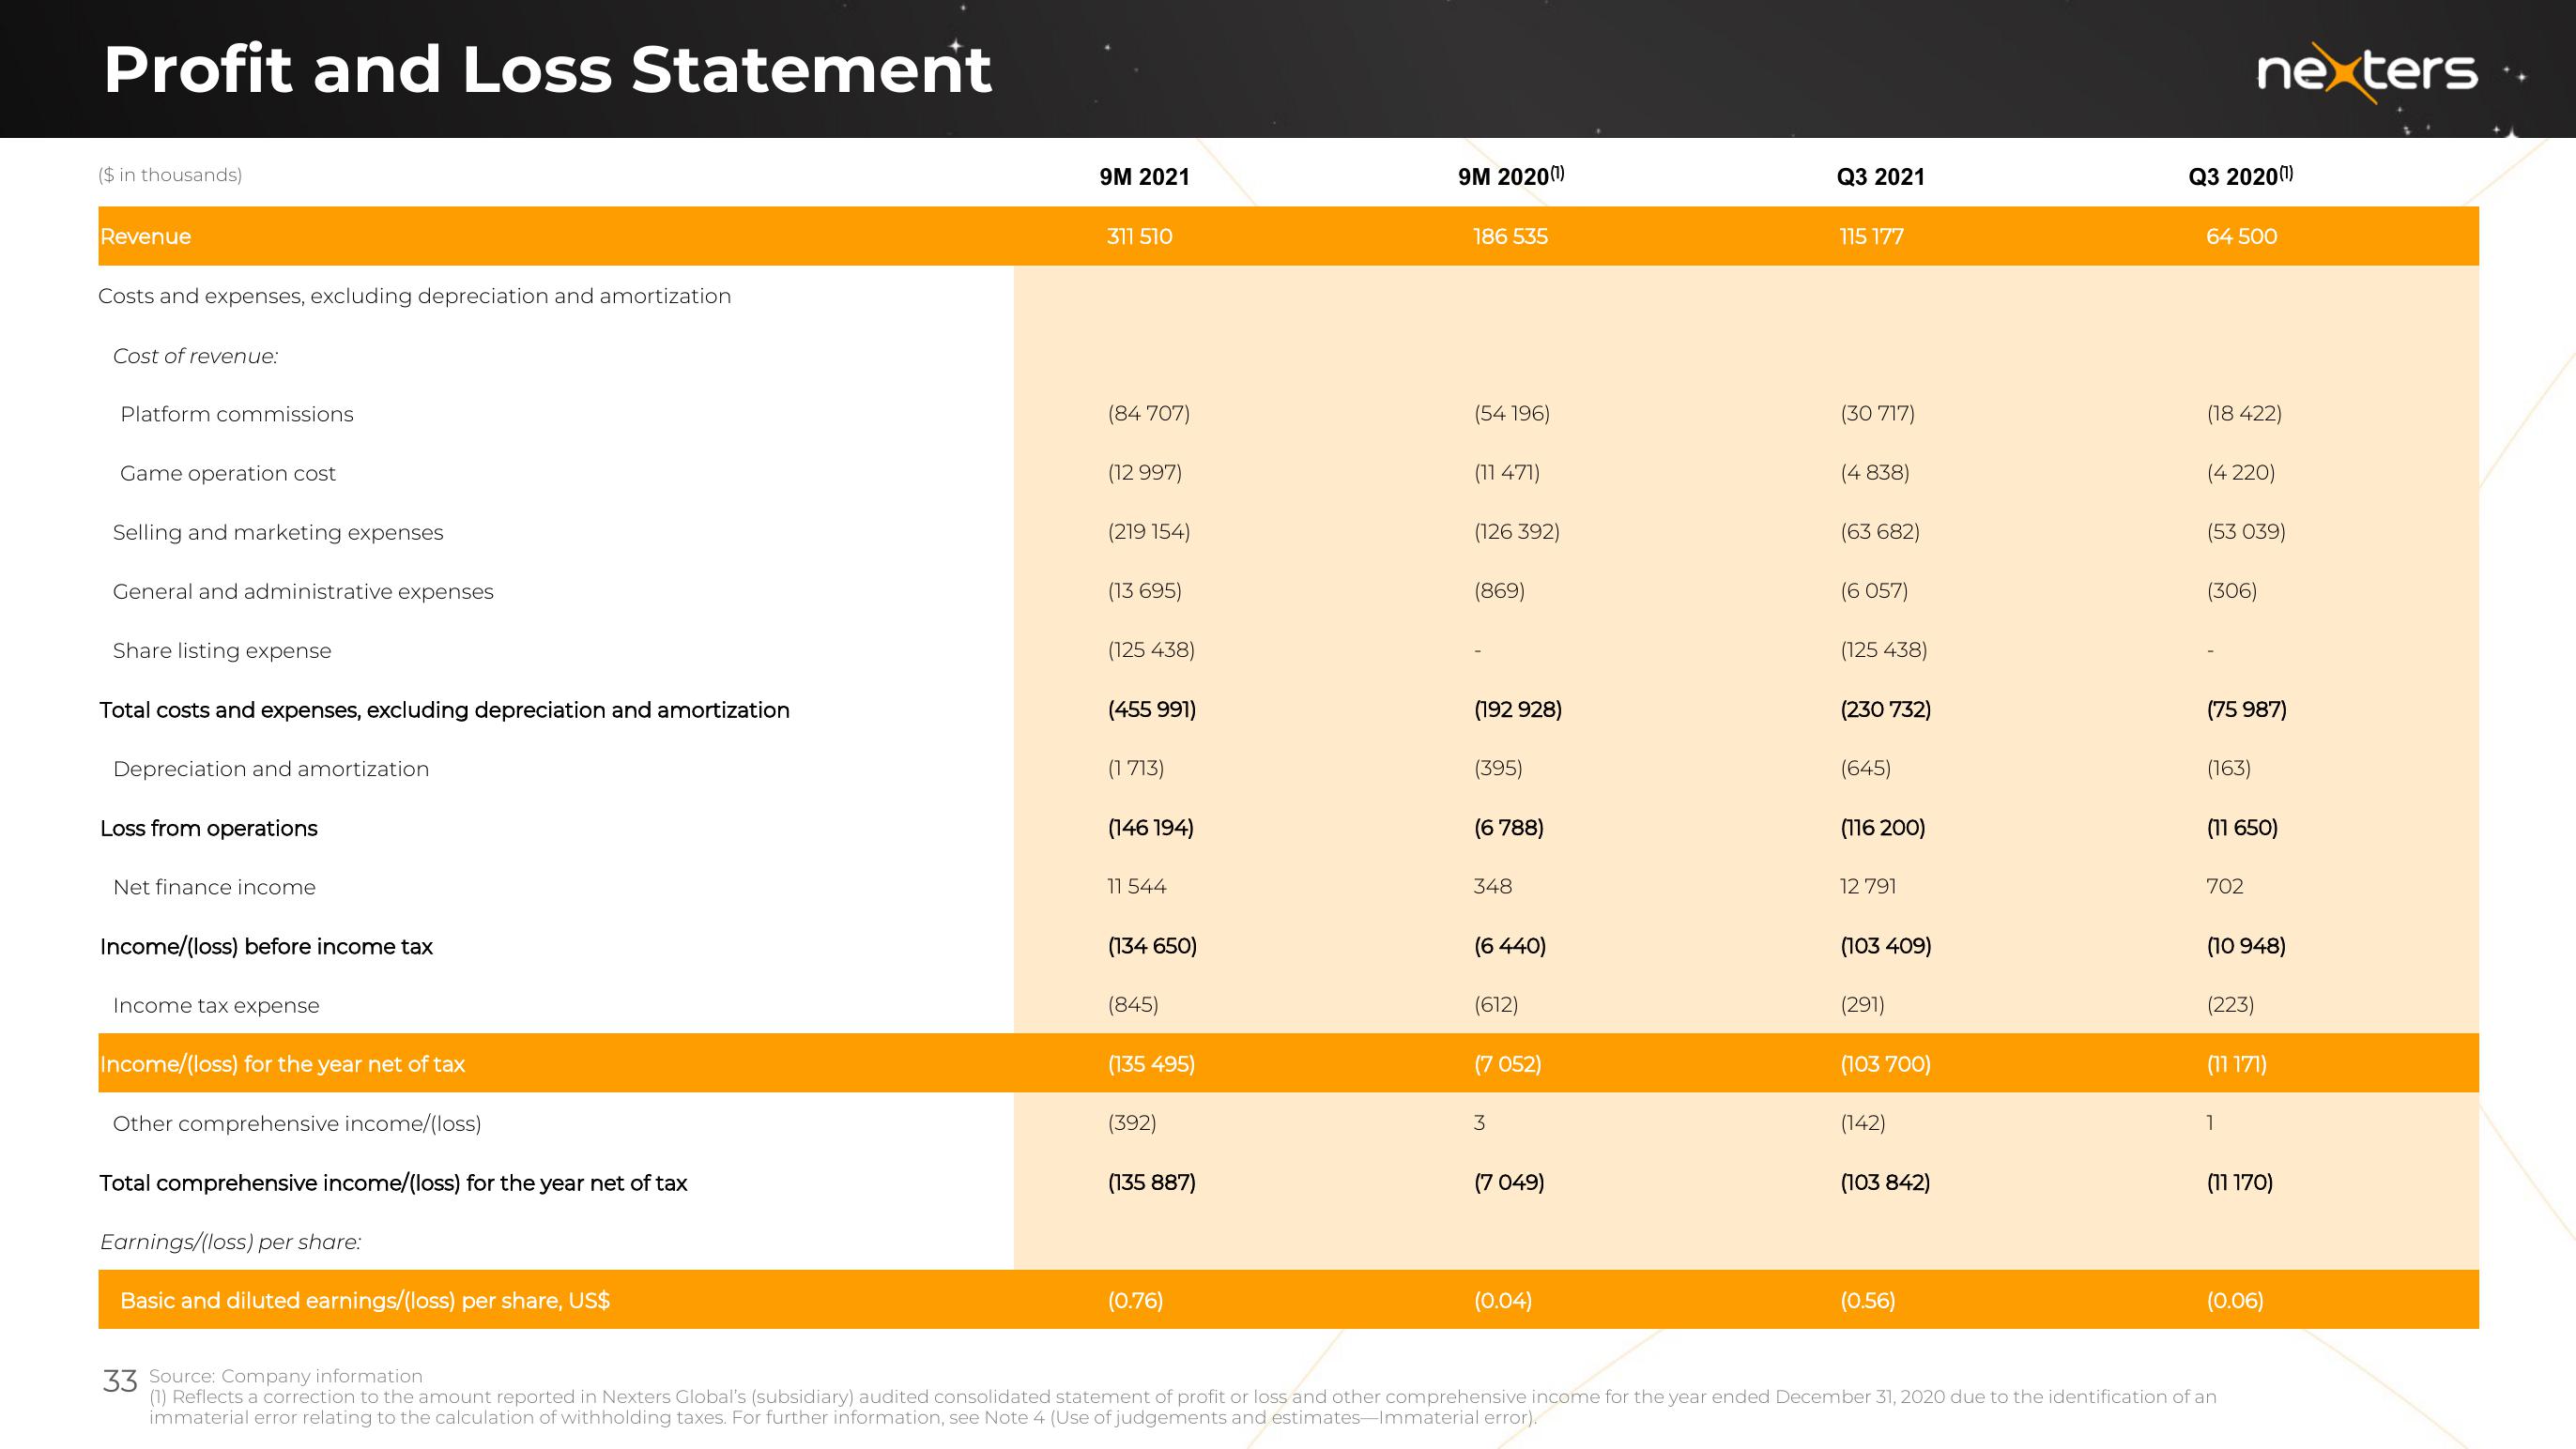
Profit and Loss Statement
($ in thousands)
Revenue
Costs and expenses, excluding depreciation and amortization
Cost of revenue:
Platform commissions
Game operation cost
Selling and marketing expenses
General and administrative expenses
Share listing expense
Total costs and expenses, excluding depreciation and amortization
Depreciation and amortization
Loss from operations
Net finance income
Income/(loss) before income tax
Income tax expense
Income/(loss) for the year net of tax
Other comprehensive income/(loss)
Total comprehensive income/(loss) for the year net of tax
Earnings/(loss) per share:
Basic and diluted earnings/(loss) per share, US$
9M 2021
311 510
(84 707)
(12 997)
(219 154)
(13 695)
(125 438)
(455 991)
(1713)
(146 194)
11 544
(134 650)
(845)
(135 495)
(392)
(135 887)
(0.76)
9M 2020 (¹)
186 535
(54 196)
(11 471)
(126 392)
(869)
(192 928)
(395)
(6 788)
348
(6 440)
(612)
(7 052)
3
(7 049)
(0.04)
Q3 2021
115 177
(30 717)
(4 838)
(63 682)
(6 057)
(125 438)
(230 732)
(645)
(116 200)
12 791
(103 409)
(291)
(103 700)
(142)
(103 842)
(0.56)
Q3 20200¹)
64 500
(18 422)
nexters..
(4220)
(53 039)
(306)
(75 987)
(163)
(11 650)
702
(10 948)
(223)
(11 171)
1
(11 170)
(0.06)
33 Source: Company information
(1) Reflects a correction to the amount reported in Nexters Global's (subsidiary) audited consolidated statement of profit or loss and other comprehensive income for the year ended December 31, 2020 due to the identification of an
immaterial error relating to the calculation of withholding taxes. For further information, see Note 4 (Use of judgements and estimates-Immaterial error).View entire presentation