Pathward Financial Results Presentation Deck
■
LOAN PORTFOLIO INTEREST
RATE SENSITIVITY
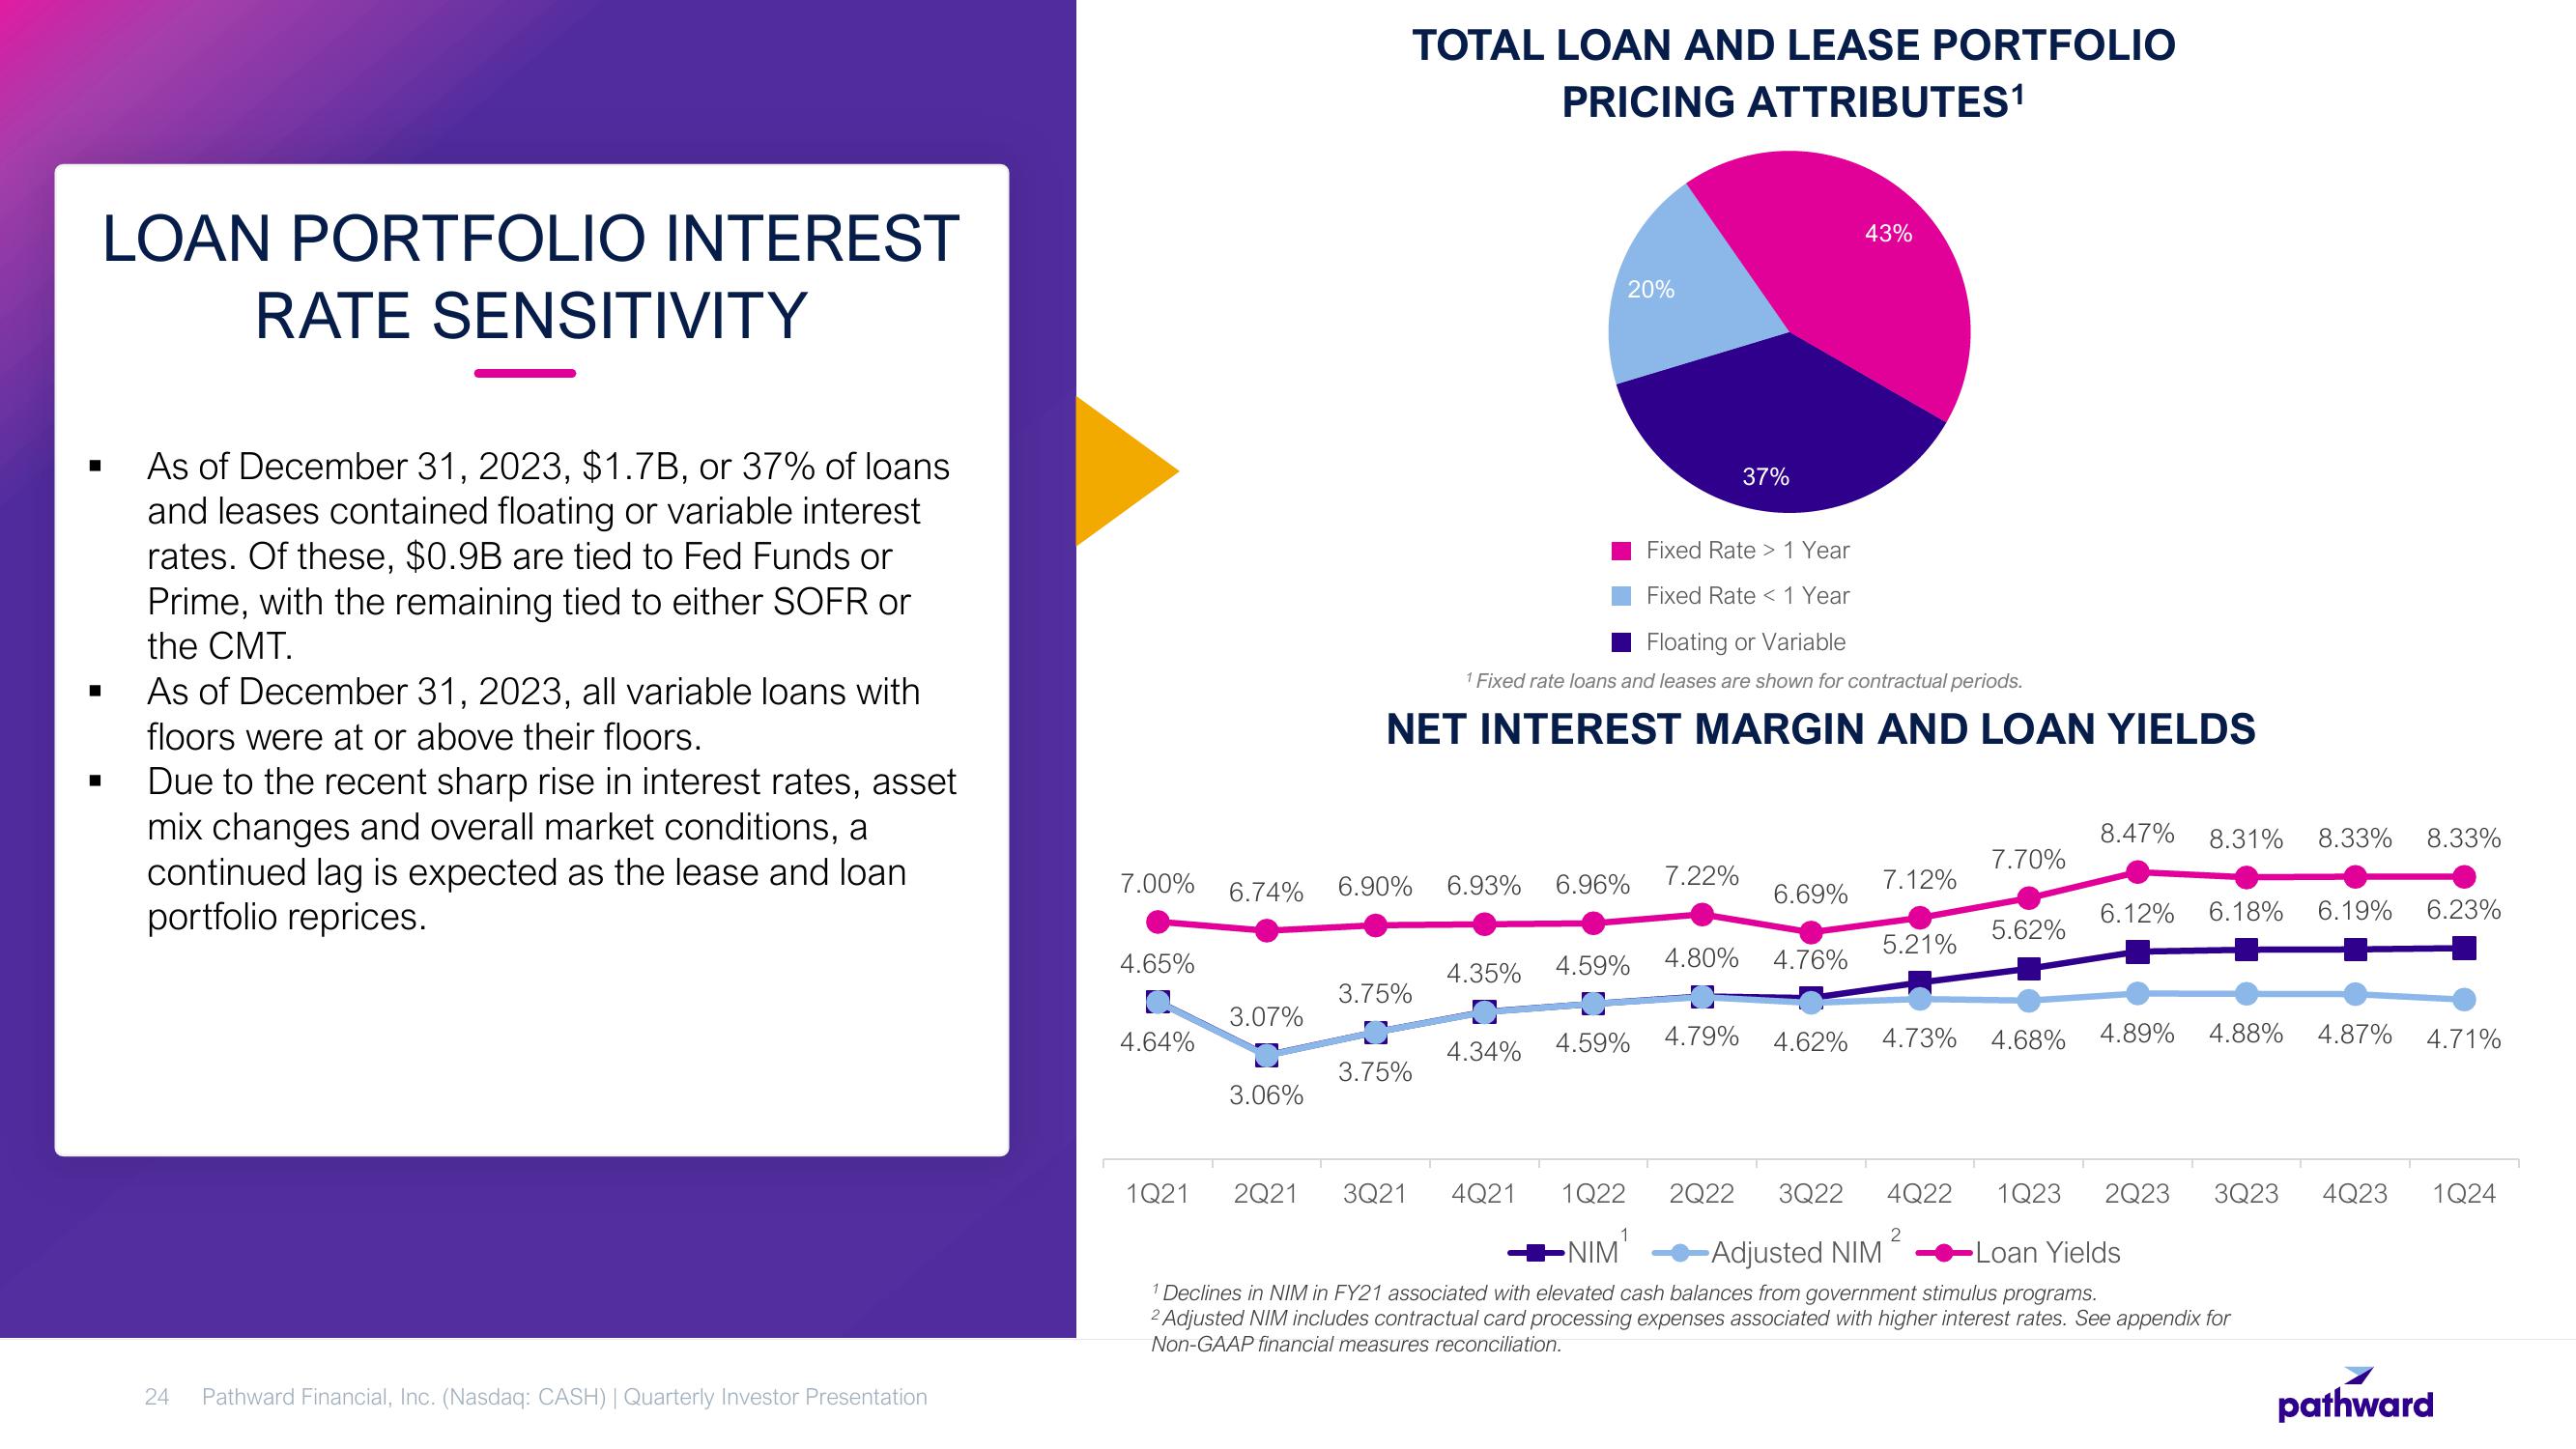
As of December 31, 2023, $1.7B, or 37% of loans
and leases contained floating or variable interest
rates. Of these, $0.9B are tied to Fed Funds or
Prime, with the remaining tied to either SOFR or
the CMT.
As of December 31, 2023, all variable loans with
floors were at or above their floors.
Due to the recent sharp rise in interest rates, asset
mix changes and overall market conditions, a
continued lag is expected as the lease and loan
portfolio reprices.
24
Pathward Financial, Inc. (Nasdaq: CASH) | Quarterly Investor Presentation
7.00%
4.65%
4.64%
6.74%
3.07%
3.06%
6.90%
3.75%
TOTAL LOAN AND LEASE PORTFOLIO
PRICING ATTRIBUTES¹
3.75%
Fixed Rate > 1 Year
Fixed Rate < 1 Year
Floating or Variable
1 Fixed rate loans and leases are shown for contractual periods.
NET INTEREST MARGIN AND LOAN YIELDS
20%
6.93% 6.96%
4.35%
4.34%
4.59% 4.80%
4.59%
7.22%
1Q21 2Q21 3Q21 4Q21 1Q22
1
•NIM¹
37%
4.79%
6.69%
4.76%
43%
4.62%
7.12%
5.21%
4.73%
2Q22 3Q22 4Q22
2
7.70%
5.62%
4.68%
8.47% 8.31% 8.33%
6.12% 6.18% 6.19%
4.89%
4.88%
4.87%
-Adjusted NIM
-Loan Yields
1 Declines in NIM in FY21 associated with elevated cash balances from government stimulus programs.
2 Adjusted NIM includes contractual card processing expenses associated with higher interest rates. See appendix for
Non-GAAP financial measures reconciliation.
8.33%
6.23%
4.71%
1Q23 2Q23 3Q23 4Q23 1Q24
pathwardView entire presentation