Aptiv Overview
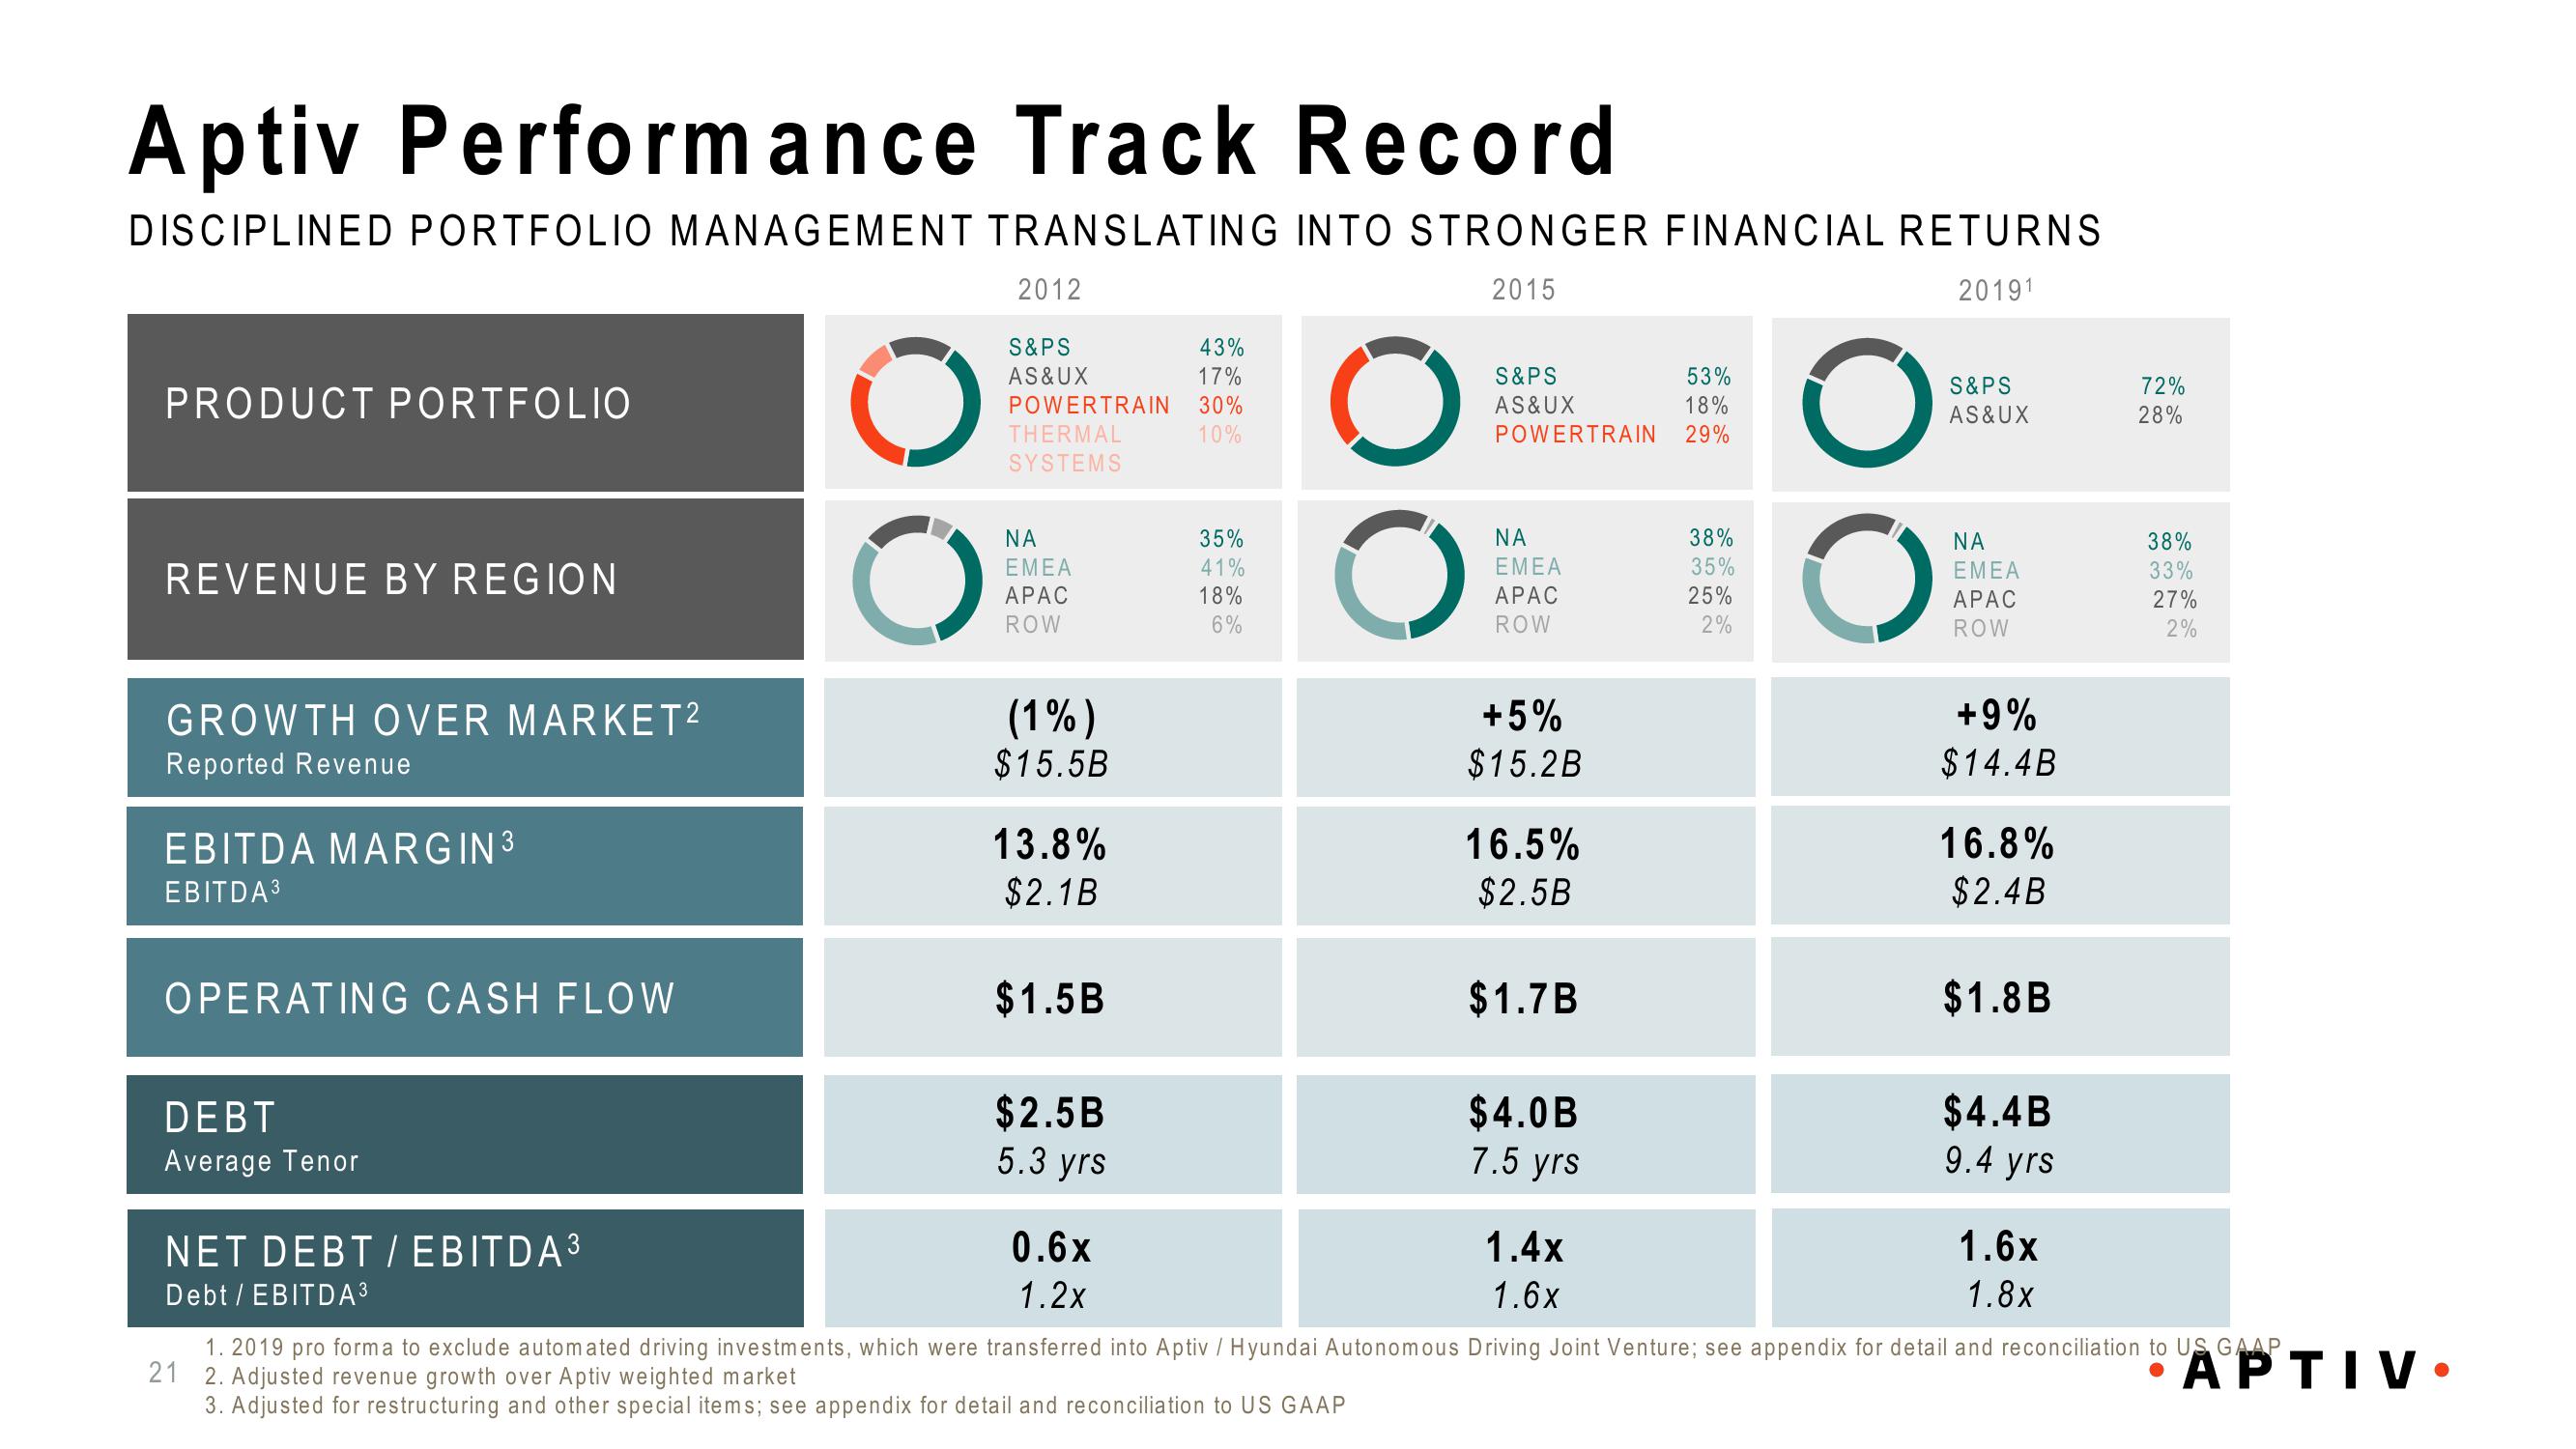
Aptiv Performance Track Record
DISCIPLINED PORTFOLIO MANAGEMENT TRANSLATING INTO STRONGER FINANCIAL RETURNS
2015
20191
PRODUCT PORTFOLIO
REVENUE BY REGION
GROWTH OVER MARKET²
Reported Revenue
EBITDA MARGIN ³
EBITDA ³
OPERATING CASH FLOW
DEBT
Average Tenor
NET DEBT/EBITDA 3
Debt / EBITDA³
O
O
2012
S&PS
AS&UX
POWERTRAIN
THERMAL
SYSTEMS
ΝΑ
ΕΜΕΑ
APAC
ROW
(1%)
$15.5B
13.8%
$2.1B
$1.5B
$2.5B
5.3 yrs
0.6x
1.2x
43%
17%
30%
10%
35%
41%
18%
6%
O
O
S&PS
AS&UX
POWERTRAIN
ΝΑ
ΕΜΕΑ
APAC
ROW
+5%
$15.2B
16.5%
$2.5B
$1.7B
$4.0B
7.5 yrs
1.4x
1.6x
53%
18%
29%
38%
35%
25%
2%
O
S&PS
AS&UX
ΝΑ
EMEA
APAC
ROW
+9%
$14.4B
16.8%
$2.4B
$1.8B
$4.4B
9.4 yrs
1.6x
1.8x
72%
28%
38%
33%
27%
2%
1. 2019 pro forma to exclude automated driving investments, which were transferred into Aptiv / Hyundai Autonomous Driving Joint Venture; see appendix for detail and reconciliation to US GAAP
21 2. Adjusted revenue growth over Aptiv weighted market
APTIV.
3. Adjusted for restructuring and other special items; see appendix for detail and reconciliation to US GAAPView entire presentation