Grove SPAC Presentation Deck
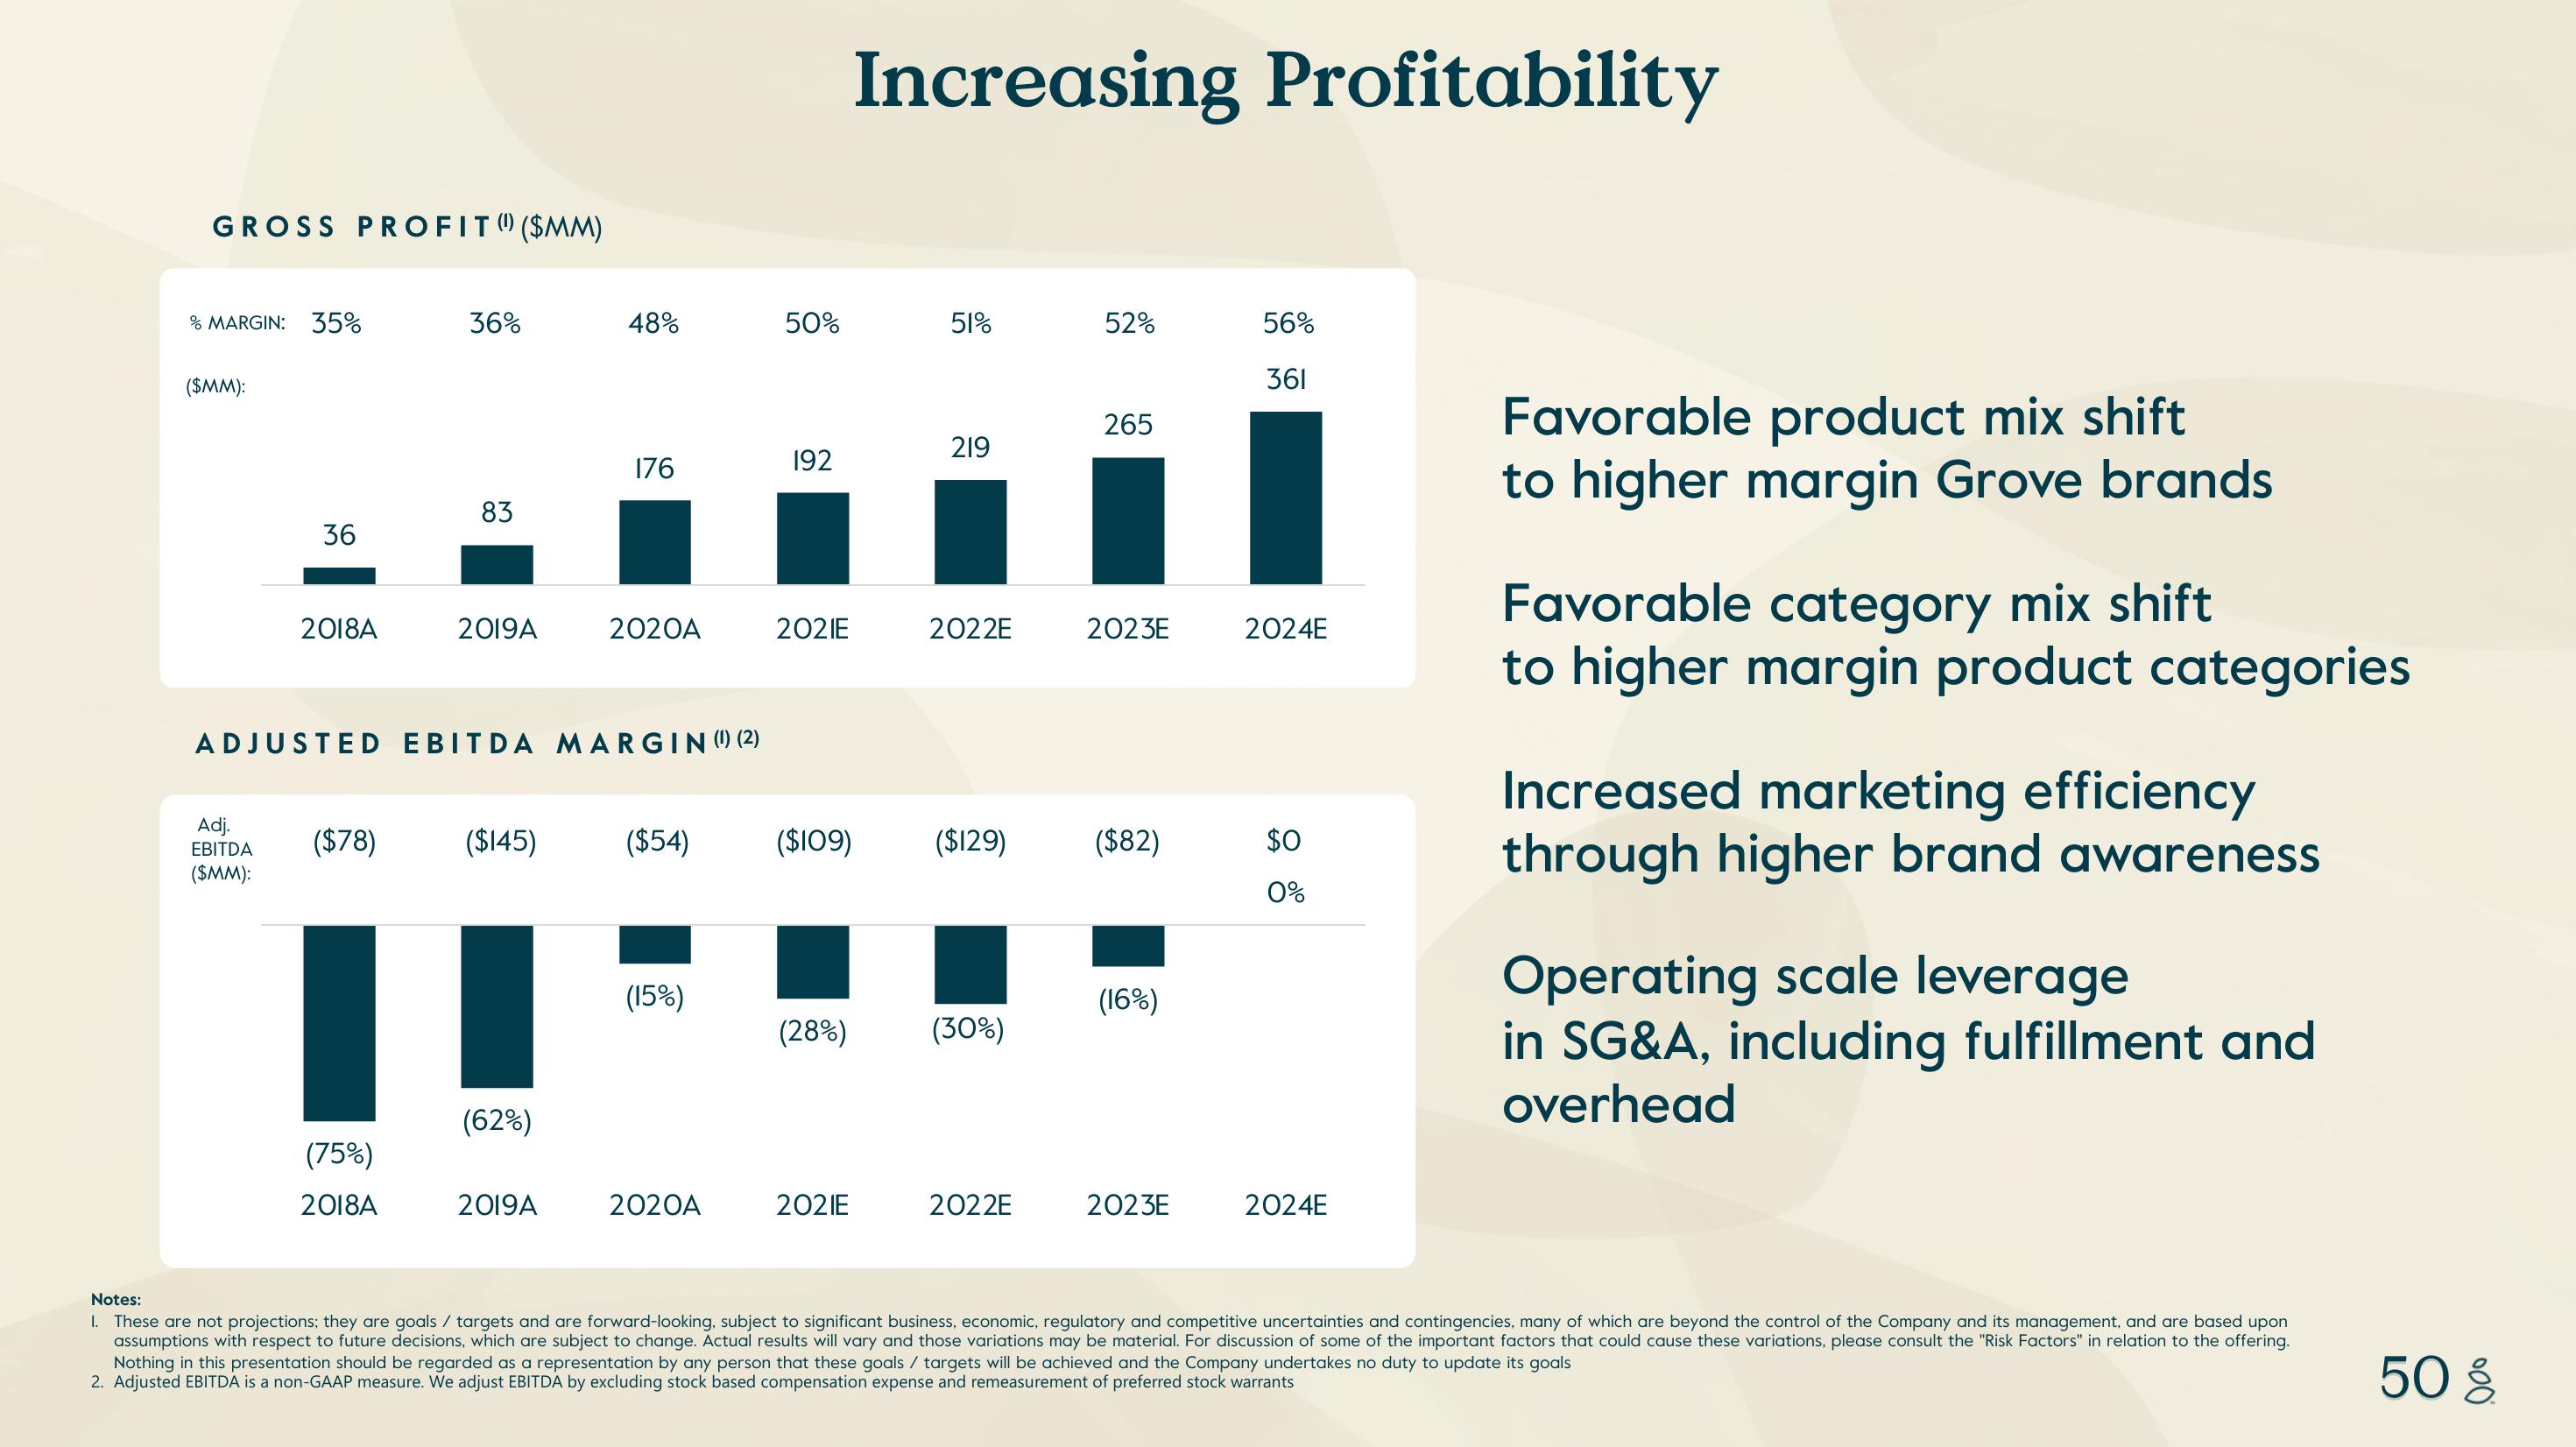
GROSS PROFIT() ($MM)
% MARGIN: 35%
($MM):
36
Adj.
EBITDA
($MM):
2018A
($78)
36%
(75%)
2018A
83
2019A
ADJUSTED EBITDA MARGIN (1) (2)
($145)
(62%)
48%
2019A
176
2020A
($54)
(15%)
2020A
50%
192
2021E
Increasing Profitability
51%
2021E
219
2022E
($109) ($129)
(28%) (30%)
2022E
52%
265
2023E
($82)
(16%)
2023E
56%
361
2024E
$0
0%
2024E
Favorable product mix shift
to higher margin Grove brands
Favorable category mix shift
to higher margin product categories
Increased marketing efficiency
through higher brand awareness
Operating scale leverage
in SG&A, including fulfillment and
overhead
Notes:
I. These are not projections; they are goals / targets and are forward-looking, subject to significant business, economic, regulatory and competitive uncertainties and contingencies, many of which are beyond the control of the Company and its management, and are based upon
assumptions with respect to future decisions, which are subject to change. Actual results will vary and those variations may be material. For discussion of some of the important factors that could cause these variations, please consult the "Risk Factors" in relation to the offering.
Nothing in this presentation should be regarded as a representation by any person that these goals / targets will be achieved and the Company undertakes no duty to update its goals
2. Adjusted EBITDA is a non-GAAP measure. We adjust EBITDA by excluding stock based compensation expense and remeasurement of preferred stock warrants
50 %View entire presentation