Silicon Valley Bank Results Presentation Deck
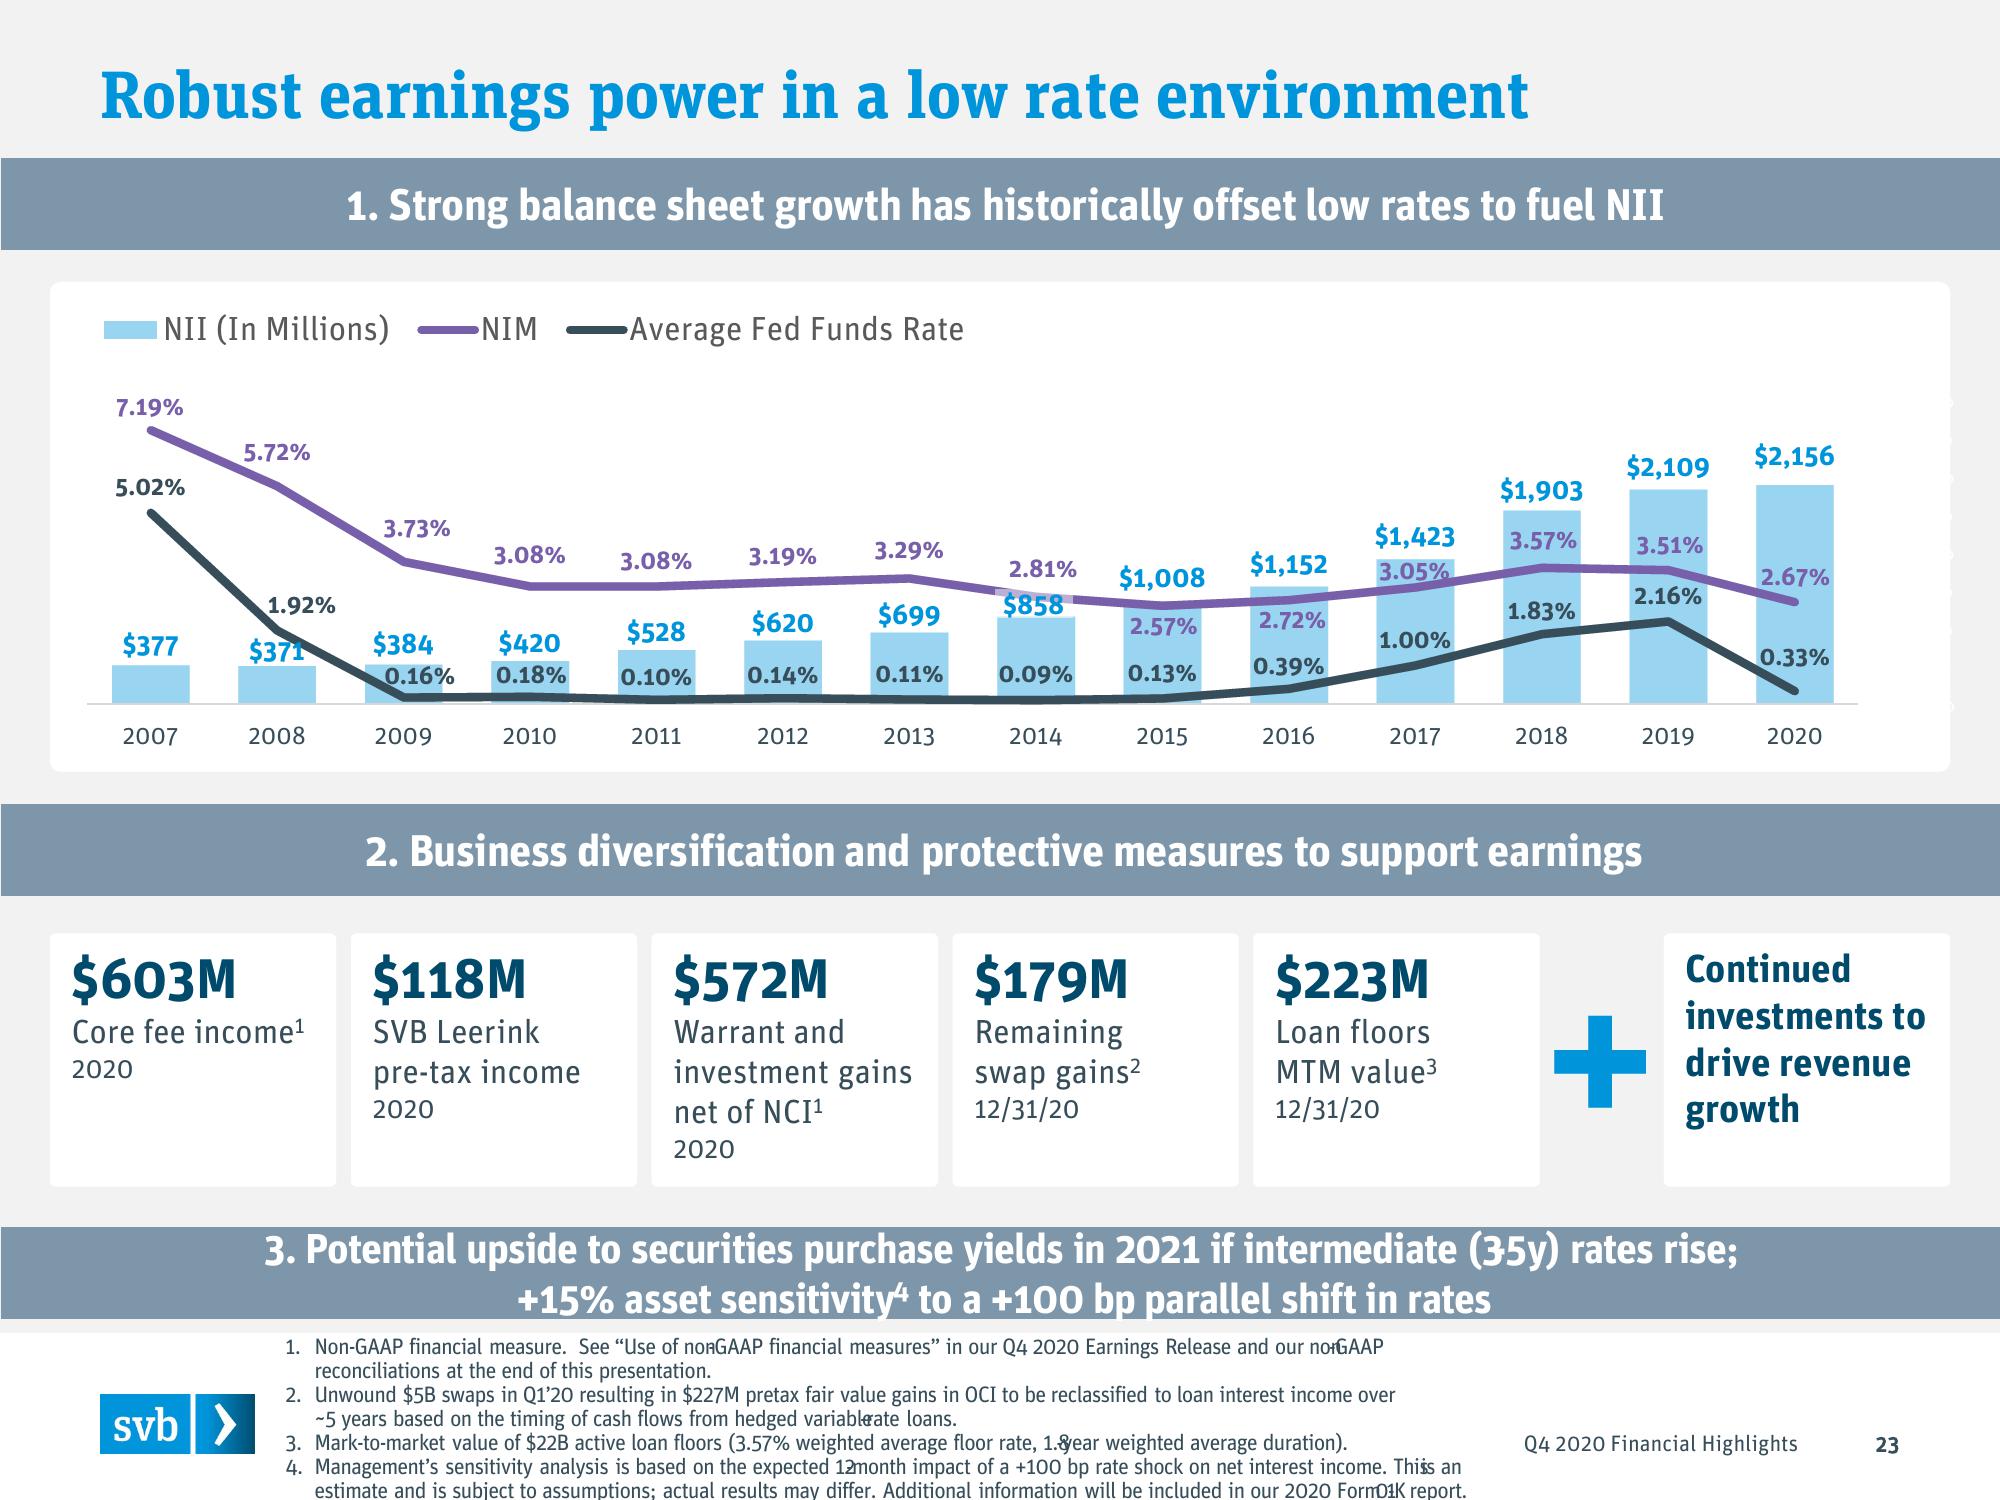
Robust earnings power in a low rate environment
1. Strong balance sheet growth has historically offset low rates to fuel NII
NII (In Millions)
7.19%
5.02%
$377
2007
5.72%
svb >
1.92%
$371
2008
$603M
Core fee income¹
2020
3.73%
NIM -Average Fed Funds Rate
2009
3.08%
$384 $420
0.16% 0.18%
2010
3.08%
$118M
SVB Leerink
pre-tax income
2020
$528
0.10%
2011
3.19%
$620
0.14%
2012
3.29%
2.81%
$699 $858
0.11%
2013
0.09%
$572M
Warrant and
investment gains
net of NCI¹
2020
2014
$1,152
$1,008
2.57%
0.13%
2015
2.72%
0.39%
$179M
Remaining
swap gains²
12/31/20
2016
$1,903
$1,423 3.57%
3.05%
1.00%
2017
$223M
Loan floors
MTM value³
12/31/20
1.83%
2018
2. Business diversification and protective measures to support earnings
1. Non-GAAP financial measure. See "Use of nonGAAP financial measures" in our Q4 2020 Earnings Release and our no GAAP
reconciliations at the end of this presentation.
2. Unwound $5B swaps in Q1'20 resulting in $227M pretax fair value gains in OCI to be reclassified to loan interest income over
-5 years based on the timing of cash flows from hedged variableate loans.
3. Mark-to-market value of $22B active loan floors (3.57% weighted average floor rate, 1.ear weighted average duration).
4. Management's sensitivity analysis is based on the expected 12month impact of a +100 bp rate shock on net interest income. Thiss an
estimate and is subject to assumptions; actual results may differ. Additional information will be included in our 2020 FormD¹K report.
$2,109
3.51%
2.16%
2019
+
3. Potential upside to securities purchase yields in 2021 if intermediate (35y) rates rise;
+15% asset sensitivity to a +100 bp parallel shift in rates
$2,156
2.67%
0.33%
2020
Continued
investments to
drive revenue
growth
Q4 2020 Financial Highlights
23View entire presentation