Tradeweb Investor Presentation Deck
4. TANGIBLE GROWTH OPPORTUNITIES
Building a Next Generation U.S. Corporate Credit Market Place Tradeweb
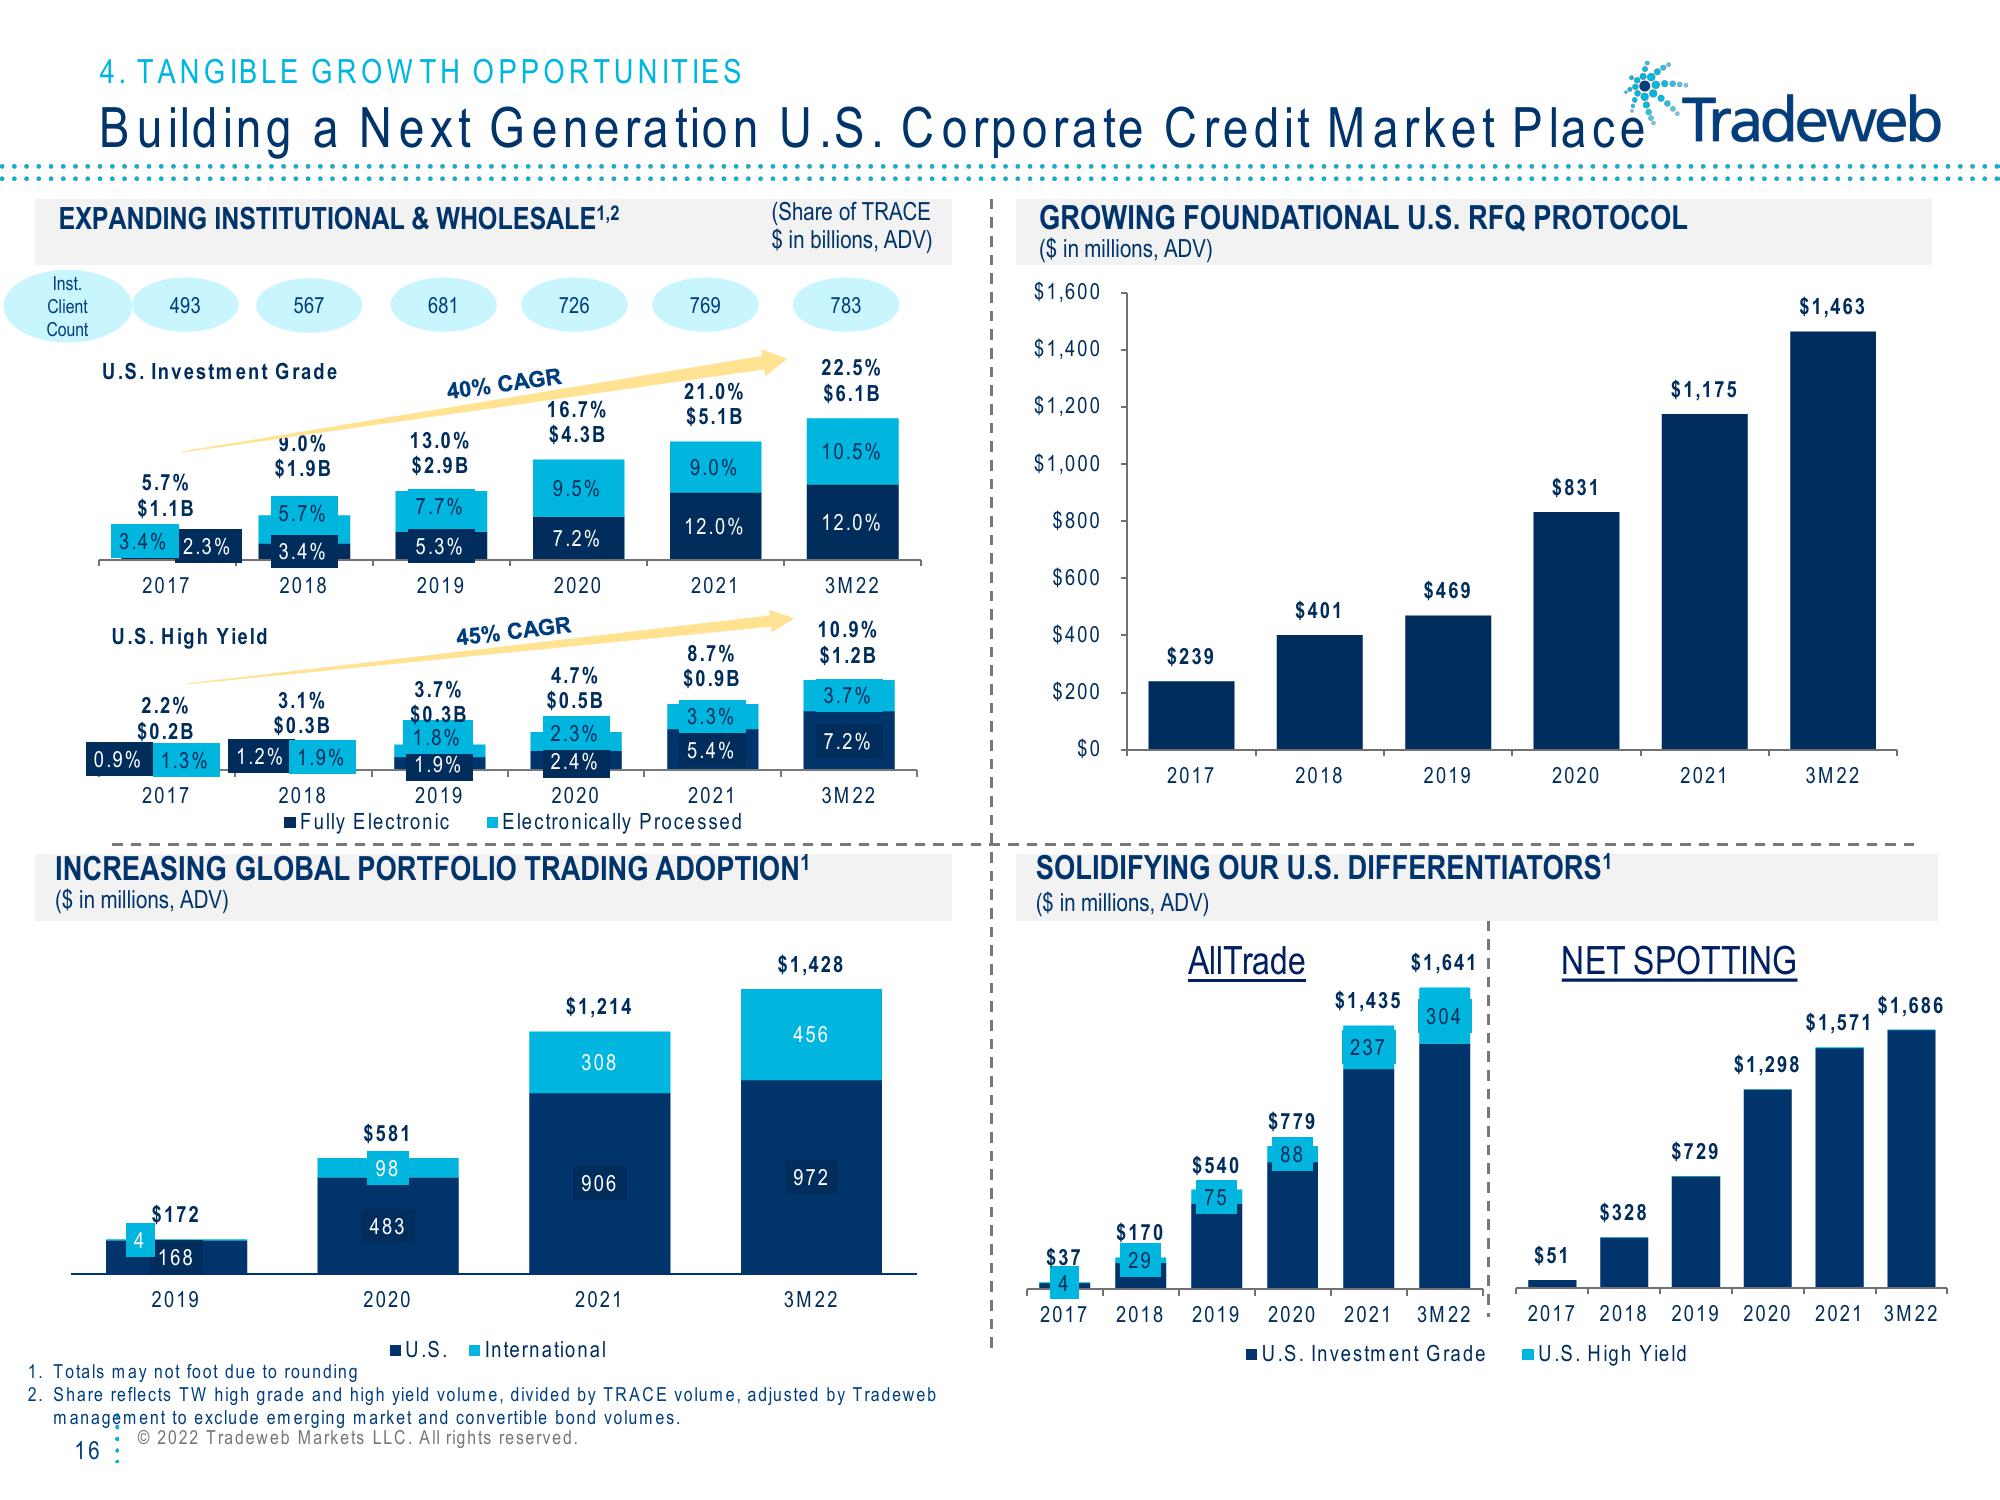
EXPANDING INSTITUTIONAL & WHOLESALE ¹,2
Inst.
Client
Count
493
U.S. Investment Grade
5.7%
$1.1B
3.4% 2.3%
2017
U.S. High Yield
2.2%
$0.2B
0.9% 1.3%
2017
4
567
$172
168
2019
9.0%
$1.9B
5.7%
3.4%
2018
3.1%
$0.3B
1.2% 1.9%
681
13.0%
$2.9B
7.7%
5.3%
2019
3.7%
$0.3B
1.8%
1.9%
2018
2019
■Fully Electronic
$581
98
483
40% CAGR
2020
726
16.7%
$4.3B
9.5%
7.2%
2020
45% CAGR
4.7%
$0.5B
2.3%
2.4%
$1,214
INCREASING GLOBAL PORTFOLIO TRADING ADOPTION¹
($ in millions, ADV)
308
769
906
21.0%
$5.1B
9.0%
2021
12.0%
2021
2020
Electronically Processed
2021
8.7%
$0.9B
3.3%
5.4%
(Share of TRACE
$ in billions, ADV)
22.5%
$6.1B
783
10.5%
12.0%
3M22
10.9%
$1.2B
3.7%
7.2%
3M22
$1,428
456
972
3M22
U.S.
International
1. Totals may not foot due to rounding
2. Share reflects TW high grade and high yield volume, divided by TRACE volume, adjusted by Tradeweb
management to exclude emerging market and convertible bond volumes.
Ⓒ2022 Tradeweb Markets LLC. All rights reserved.
16
GROWING FOUNDATIONAL U.S. RFQ PROTOCOL
($ in millions, ADV)
$1,600
I
I $1,400
$1,200
$1,000
$800
$600
$400
$200
$0
$37
$239
$170
29
2017
$401
2018
$540
75
All Trade
SOLIDIFYING OUR U.S. DIFFERENTIATORS¹
($ in millions, ADV)
$779
88
$469
$1,435
237
2019
$1,641
304
I
$831
2017 2018 2019 2020 2021 3M 22
U.S. Investment Grade
2020
$51
$1,175
NET SPOTTING
$328
2021
$729
$1,463
$1,298
3M22
$1,571
$1,686
2017 2018 2019 2020 2021 3M22
U.S. High YieldView entire presentation