Evercore Investment Banking Pitch Book
Financial Summary Information
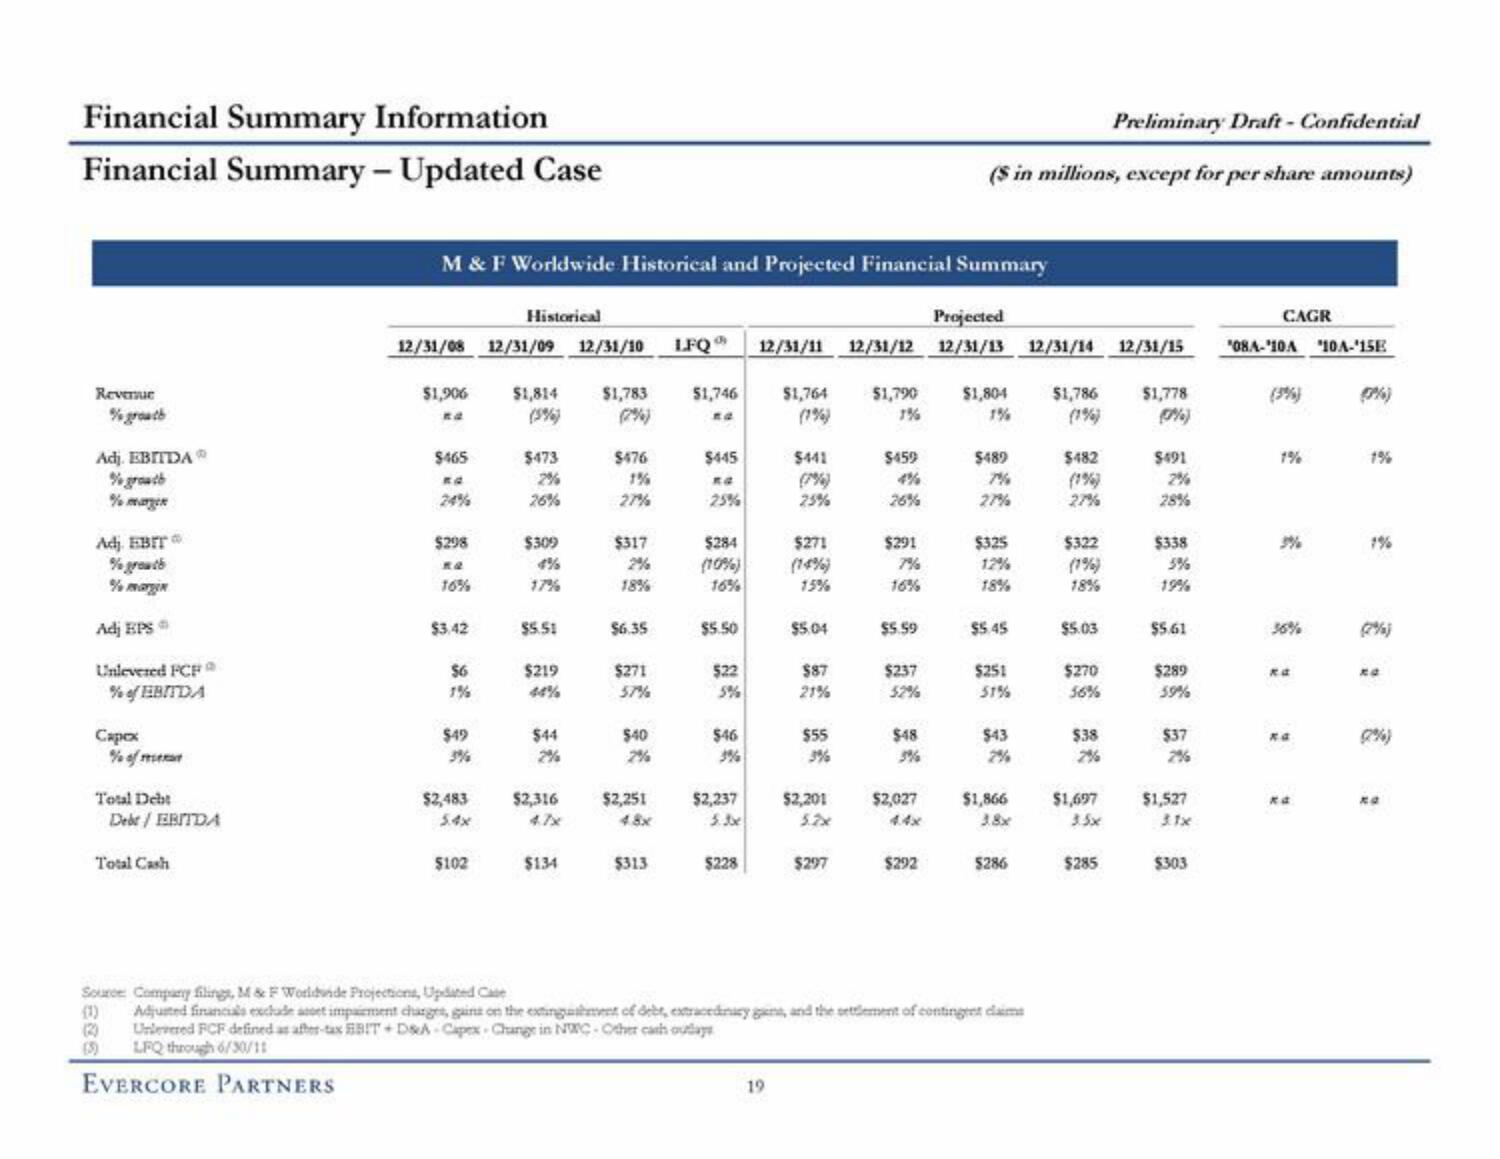
Financial Summary - Updated Case
Revenue
Adj. EBITDA
% growth
% margen
Adj. EBIT
% growth
% margin
Adj EPSⒸ
Unlevered FCF
% of EBITDA
Capex
% of mean
Total Debt
Debr/ EBITDA
Total Cash
M & F Worldwide Historical and Projected Financial Summary
12/31/08 12/31/09 12/31/10
$1,906
na
$465
na
$298
16%
$3.42
$6
1%
$49
3%
$2,483
5.4x
Historical
$102
$1,814 $1,783
(2%)
$473
2%
26%
$309
$5.51
$219
$44
$2,316
47x
$134
$476
27%
$317
2%
18%
$6.35
$271
57%
$40
2%
$2,251
4.8x
$313
LFQ
$1,746
$445
RO
25%
$284
(10%)
16%
$5.50
$22
5%
$46
$2,237
5.30
$228
Projected
12/31/11 12/31/12 12/31/13 12/31/14 12/31/15
$1,764
(1%)
19
$441
(7%)
25%
$271
(14%)
15%
$5.04
$87
21%
$55
3%
$2,201
5.2x
$297
$1,790
1%
$459
4%
26%
$291
7%
16%
$5.59
$237
52%
$48
Preliminary Draft - Confidential
($ in millions, except for per share amounts)
$2,027
$292
$1,804
1%
$489
27%
$325
12%
18%
$5.45
$251
51%
$43
$1,866
3.8x
$286
Source Company filings, M & F Worldinde Projections, Updated Case
Adjusted financials exclude anoet impairment charges, gains on the extingashment of debt, extracednary gans, and the settlement of contingret claims
(2) Unlevered FCF defined as after-tax BBIT+ DSA-Capex Change in NWC-Other cash outlays
LFQ through 6/30/11
EVERCORE PARTNERS
$1,786
(1%)
$482
27%
$322
(1%)
18%
$5.03
$270
56%
$38
2%
$1,697
$285
$1,778
(7%)
$491
2%
28%
$338
5%
19%
$5.61
$289
59%
$37
$1,527
$303
CAGR
'08A-10A 10A-'15E
1%
36%
kd
ka
(9%)
1%
(2%)
KO
(Q%)
noView entire presentation