HBT Financial Results Presentation Deck
Non-GAAP Reconciliations (cont'd)
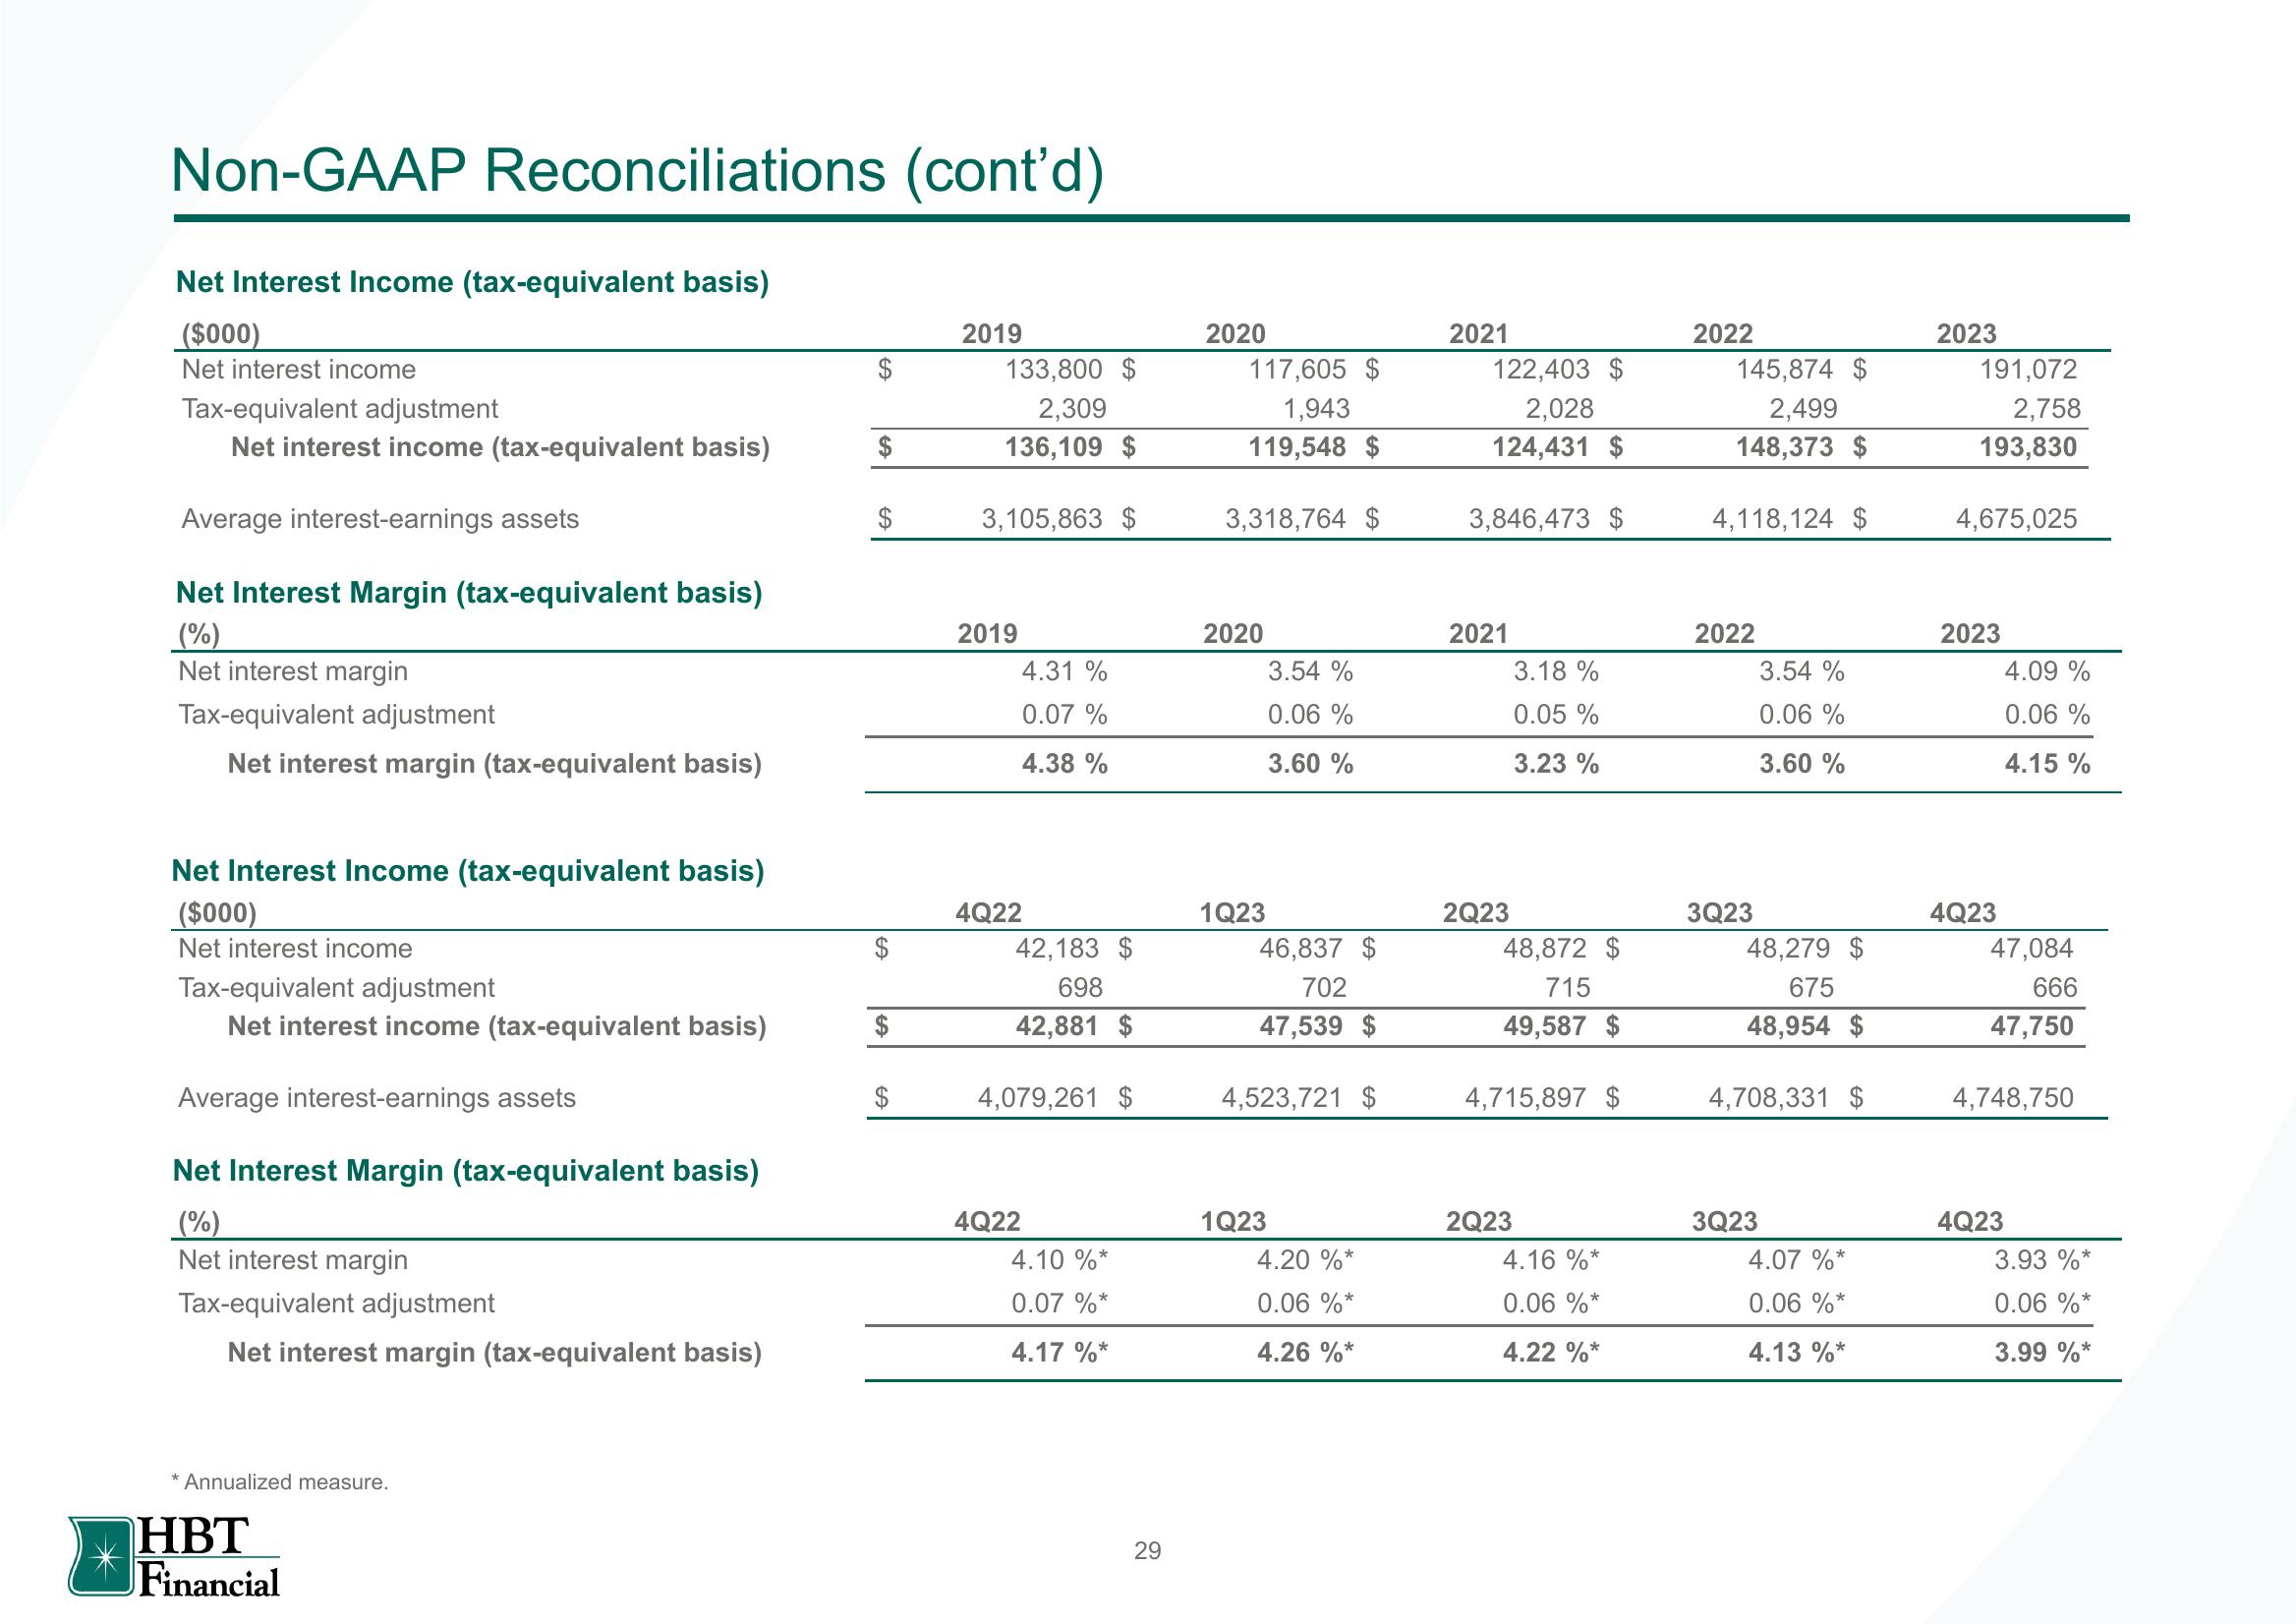
Net Interest Income (tax-equivalent basis)
($000)
Net interest income
Tax-equivalent adjustment
Net interest income (tax-equivalent basis)
Average interest-earnings assets
Net Interest Margin (tax-equivalent basis)
(%)
Net interest margin
Tax-equivalent adjustment
Net interest margin (tax-equivalent basis)
* Annualized measure.
HBT
Financial
$
$
2019
133,800 $
2,309
136,109 $
3,105,863 $
2019
4.31 %
0.07 %
4.38 %
4Q22
42,183 $
698
42,881 $
4,079,261 $
4Q22
4.10 %*
0.07 %*
4.17 %*
29
2020
117,605 $
1,943
119,548 $
3,318,764 $
2020
3.54 %
0.06 %
3.60 %
1Q23
46,837 $
702
47,539 $
4,523,721 $
1Q23
4.20 %*
0.06 %*
4.26 %*
2021
122,403 $
2,028
124,431 $
3,846,473 $
2021
2Q23
3.18 %
0.05 %
3.23%
48,872 $
715
49,587 $
4,715,897 $
2Q23
4.16 %*
0.06 %*
4.22 %*
2022
145,874 $
2,499
148,373 $
4,118,124 $
2022
3Q23
3.54%
0.06 %
3.60 %
48,279 $
675
48,954 $
4,708,331 $
3Q23
4.07 %*
0.06 %*
4.13 %*
2023
191,072
2,758
193,830
4,675,025
2023
4Q23
4.09 %
0.06 %
4.15 %
47,084
666
47,750
4,748,750
4Q23
3.93 %*
0.06 %*
3.99 %*View entire presentation