OppFi Investor Presentation Deck
13
1Q21 Results
($ in 000s)
Net Income
Adj. Revenue¹
Adj. EBITDA¹
Adj. Net Income²
Key Metrics
Net Originations
Adj. EBITDA Margin
Adj. Net Income Margin
Net Charge-Offs as % of
Average Receivables
Automatic Approval Rate
Total Cash
Unaudited
Quarter End March 31,
2021
2020
$24,384
84,257
32,361
19,256
$99,809
38%
23%
31%
41%
$95,965
$16,897
88,970
24,945
13,011
$124,146
28%
15%
46%
19%
$45,657
Key Highlights
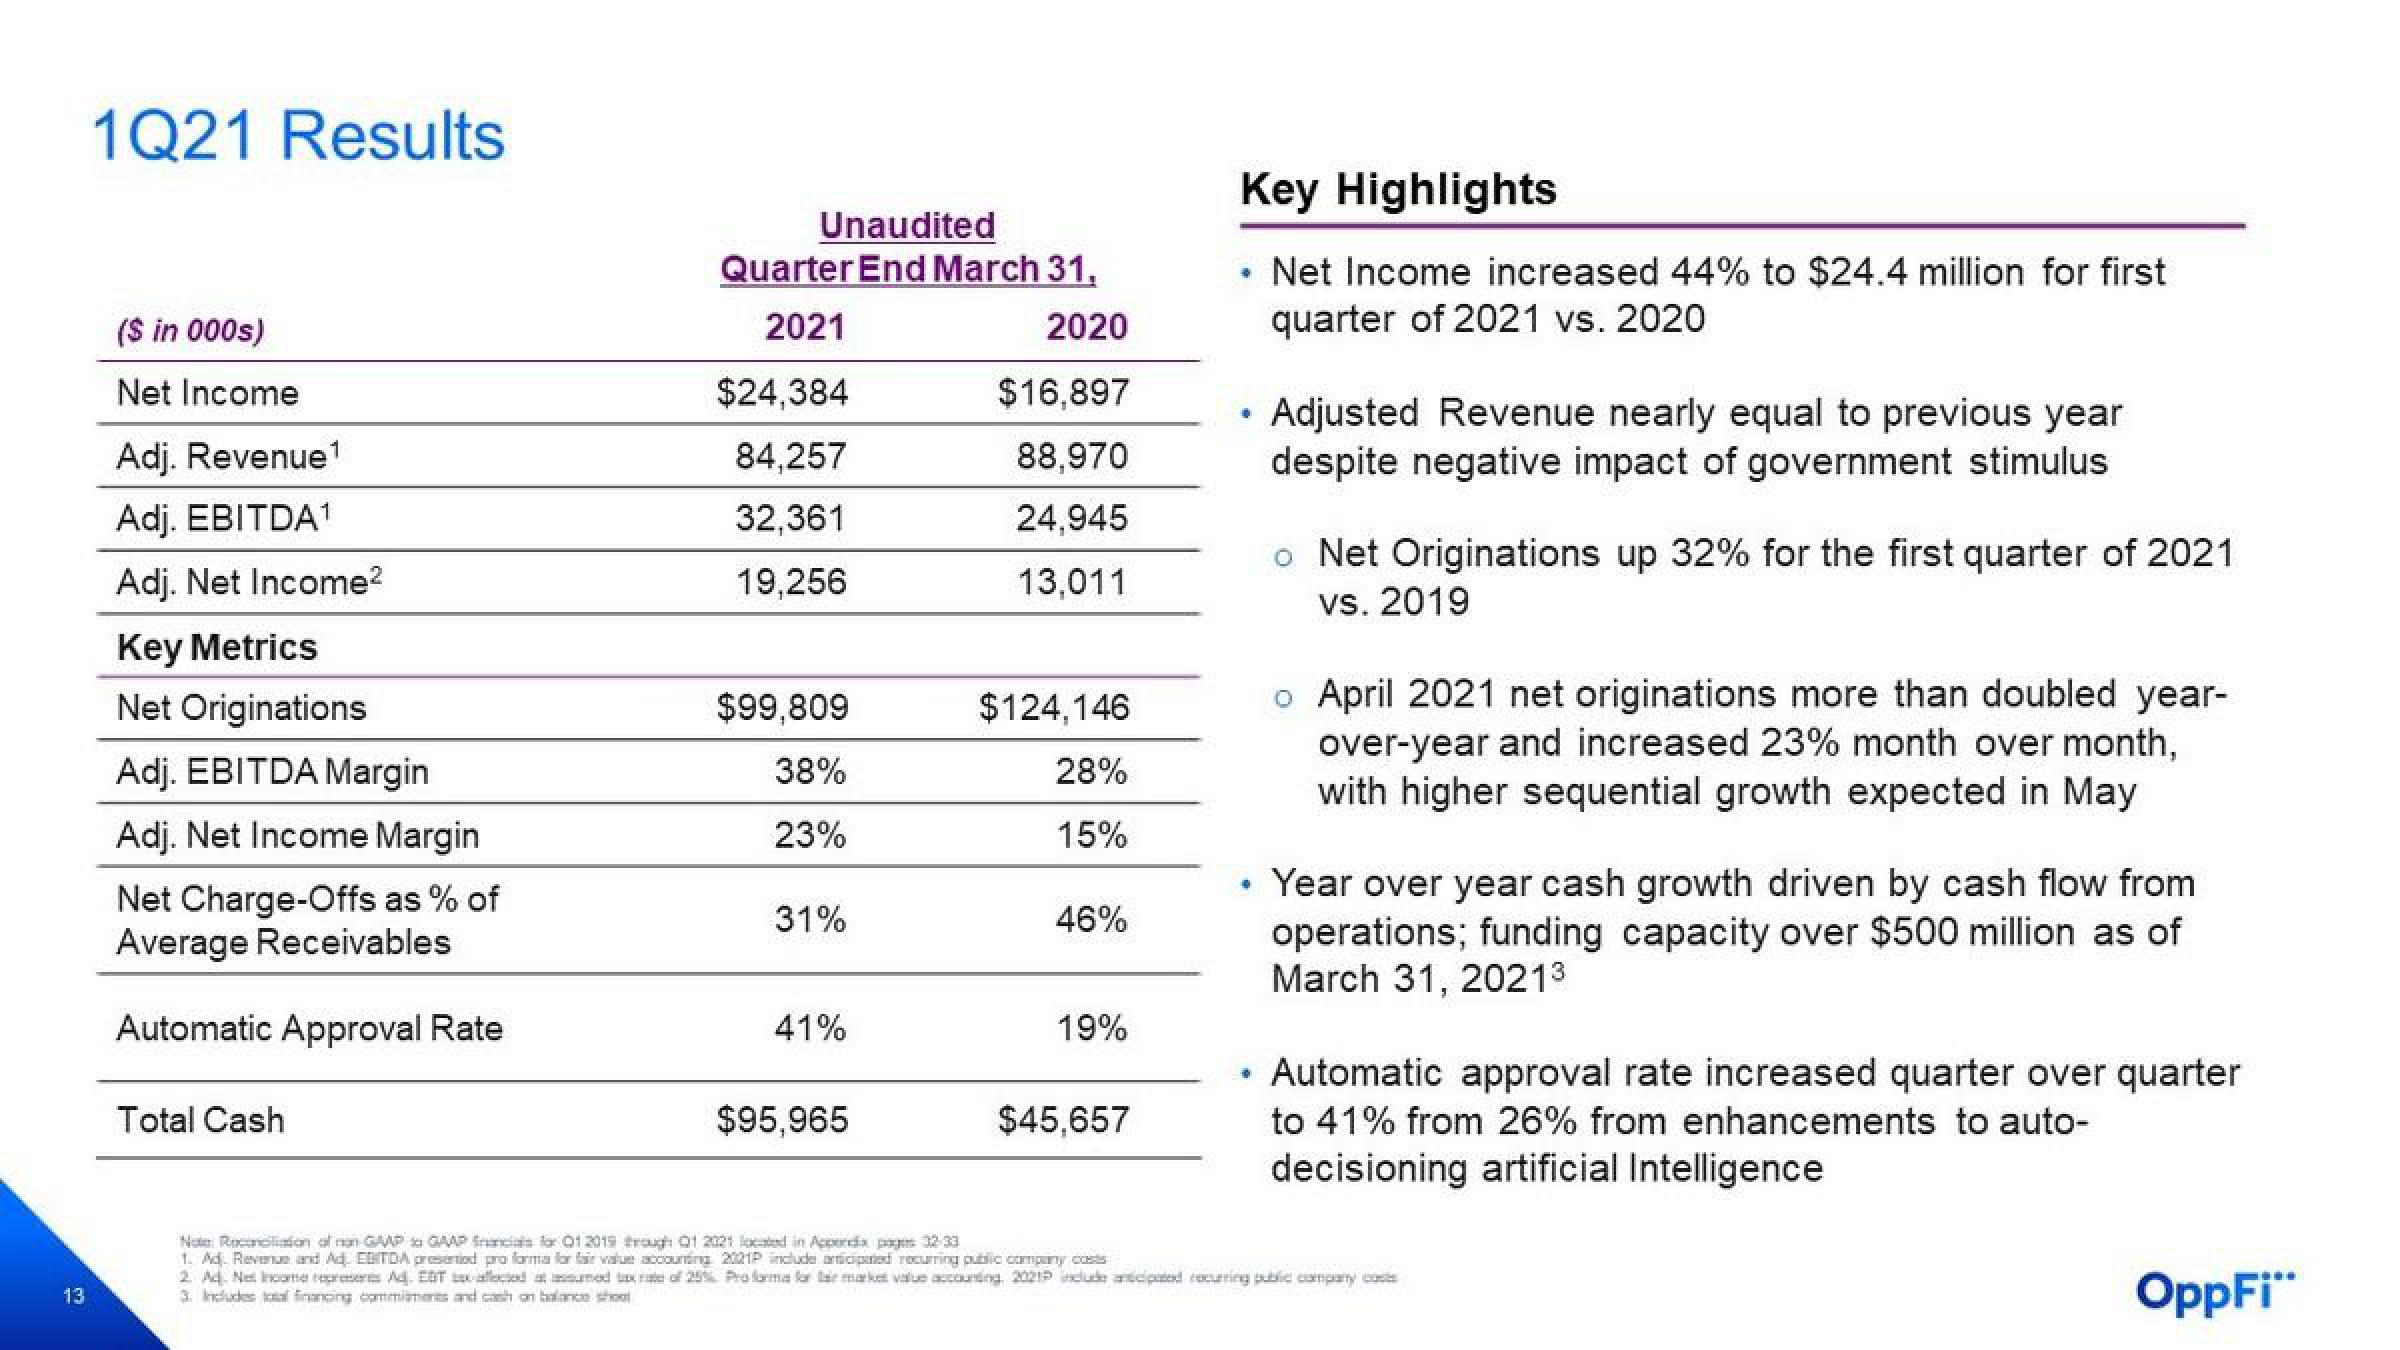
Net Income increased 44% to $24.4 million for first
quarter of 2021 vs. 2020
.
♥
Adjusted Revenue nearly equal to previous year
despite negative impact of government stimulus
o Net Originations up 32% for the first quarter of 2021
vs. 2019
o April 2021 net originations more than doubled year-
over-year and increased 23% month over month,
with higher sequential growth expected in May
Year over year cash growth driven by cash flow from
operations; funding capacity over $500 million as of
March 31, 2021³
Automatic approval rate increased quarter over quarter
to 41% from 26% from enhancements to auto-
decisioning artificial Intelligence
Not Reconciation of nan GAAP to GAAP inancials for 01 2019 through 01 2021 located in Appendix pages 32-33
1. Ad. Revenue and Ad. EDITDA presented pro forma for fair value accounting 2021P include anticipated recurring public company costs
2 Ad. Net Income
Ad. EDT alocat sumed txt of 25% Proforma for a market value accounting, 2021 include ancipated recurring public company costs
3. Includes al financing commitments and cash on balance shoo
OppFi"View entire presentation