Evercore Investment Banking Pitch Book
Financial Analysis
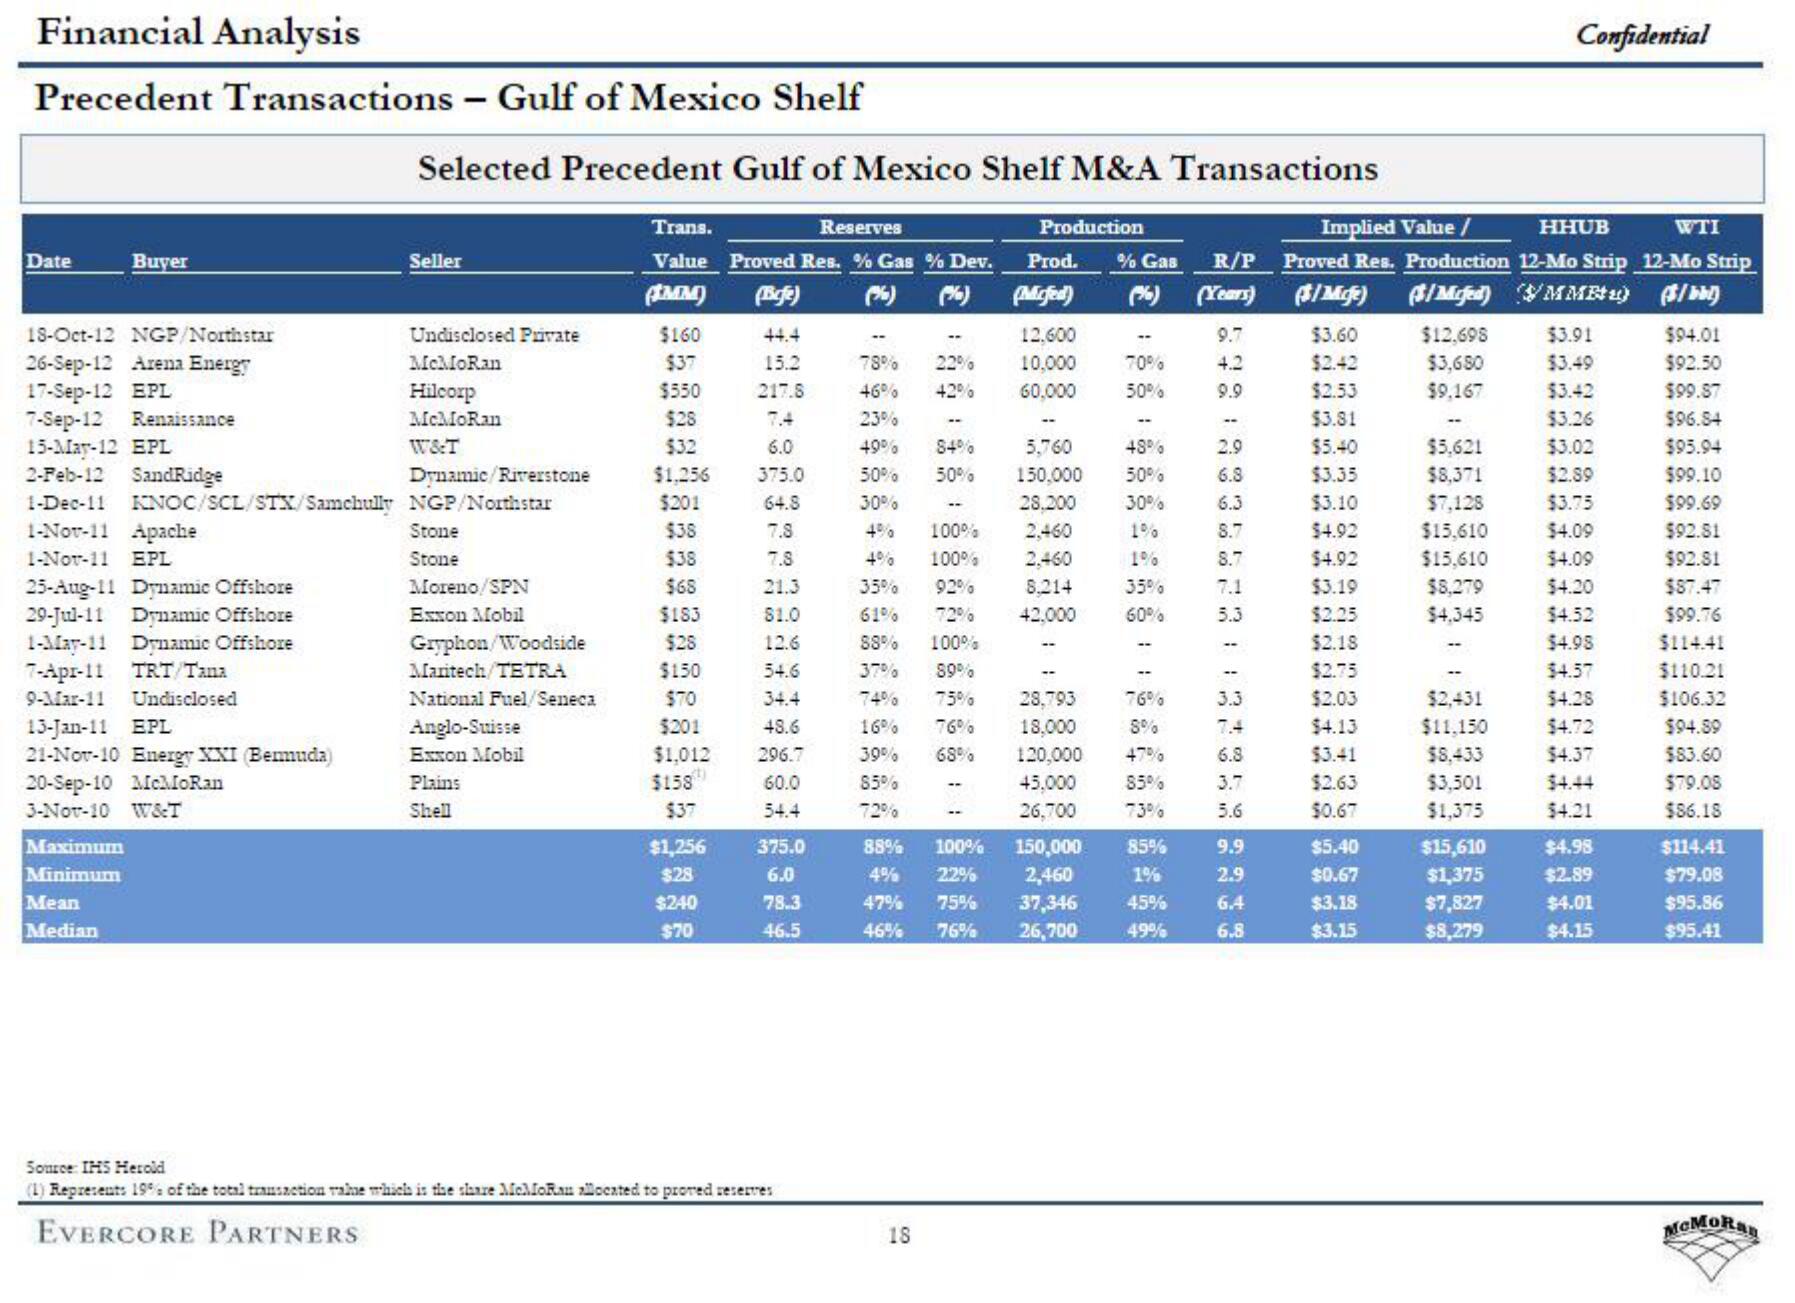
Precedent Transactions - Gulf of Mexico Shelf
Date
18-Oct-12 NGP/Northstar
26-Sep-12 Arena Energy
17-Sep-12 EPL
7-Sep-12 Renaissance
Buyer
15-May-12 EPL
2-Feb-12 SandRidge
1-Dec-11 KNOC/SCL/STX/Samchully
1-Nov-11 Apache
1-Nov-11 EPL
25-Aug-11 Dynamic Offshore
29-Jul-11 Dynamic Offshore
1-May-11 Dynamic Offshore
7-Apr-11 TRT/Tana
9-Mar-11 Undisclosed
13-Jan-11 EPL
21-Nov-10 Energy XXI (Bennuda)
20-Sep-10 McMoRan
3-Nov-10 W&T
Maximum
Minimum
Mean
Median
Selected Precedent Gulf of Mexico Shelf M&A Transactions
Seller
Undisclosed Private
McMoRan
Hilcorp
McMoRan
W&T
Dynamic Riverstone
NGP/Northstar
Stone
Stone
Moreno/SPN
Exxon Mobil
Gryphon/Woodside
Maritech/TETRA
National Fuel/Seneca
Anglo-Suisse
Exxon Mobil
Plains
Shell
Trans.
Reserves
Value Proved Res. % Gas % Dev.
(%)
(IMM) (Befe)
$160
$37
$550
$28
$32
$1.256
$201
$38
$38
$68
$183
$28
$150
$70
$201
$1,012
$158)
$37
$1,256
$28
$240
$70
44.4
15.2
217.8
6.0
375.0
64.8
7.8
7.8
21.3
$1.0
12.6
54.6
34.4
48.6
296.7
60.0
54.4
375.0
6.0
78.3
46.5
Source: IHS Herold
(1) Represents 19% of the total transaction value which is the share McMoRan allocated to proved reserves
EVERCORE PARTNERS
78% 22%
42%
46%
23%
49%
50%
30%
84%
50%
88%
100%
4%
2%
47% 75%
46% 76%
18
Production
Prod.
(Micfed)
12.600
10,000
60,000
100%
100%
35%
92%
61%
72%
88% 100%
37%
89%
74% 75%
28,793
16% 76% 18,000
39% 68% 120,000
85%
72%
5,760
150,000
28.200
2,460
2.460
8.214
42.000
1
% Gas R/P
(%) (Years)
9.7
4.2
9.9
70%
50%
48%
50%
30%
1%
1%
35%
60%
i
76%
8%
47%
45,000
26,700
150,000
2,460
37,346 45%
26,700 49%
85%
73%
85%
2.9
6.8
6.3
8.7
8.7
7.1
5.3
3.3
7.4
6.8
3.7
5.6
9.9
5
6.4
6.8
HHUB
Implied Value /
Proved Res. Production 12-Mo Strip 12-Mo Strip
(3/Micje) /Mefed) MMBtu) ($/bb
$3.60
$2.42
$2.53
$3.81
$5.40
$3.35
$3.10
$4.92
$4.92
$3.19
$2.25
$2.18
$2.75
$2.03
$4.13
$3.41
$2.63
$0.67
$5.40
$0.67
$3.18
$3.15
$12,698
$3,680
$9,167
$5,621
$8,371
$7.128
$15,610
$15,610
$8,279
$4.345
Confidential
$2,431
$11.150
$8,433
$3,501
$1,375
$15,610
$1,375
$7,827
$8,279
$3.91
$3.49
$3.42
$3.26
$3.02
$2.89
$3.75
$4.09
$4.09
$4.20
$4.52
$4.98
$4.57
$4.28
$4.72
$4.37
$4.44
$4.21
$4.98
$2.89
$4.01
$4.15
WTI
$94.01
$92.50
$99.87
$96.84
$95.94
$99.10
$99.69
$92.51
$92.81
$87.47
$99.76
$114.41
$110.21
$106.32
$94.89
$83.60
$79.08
$86.18
$114.41
$79.08
$95.86
$95.41
McMoRanView entire presentation