WeWork Results Presentation Deck slide image

WeWork Results Presentation Deck

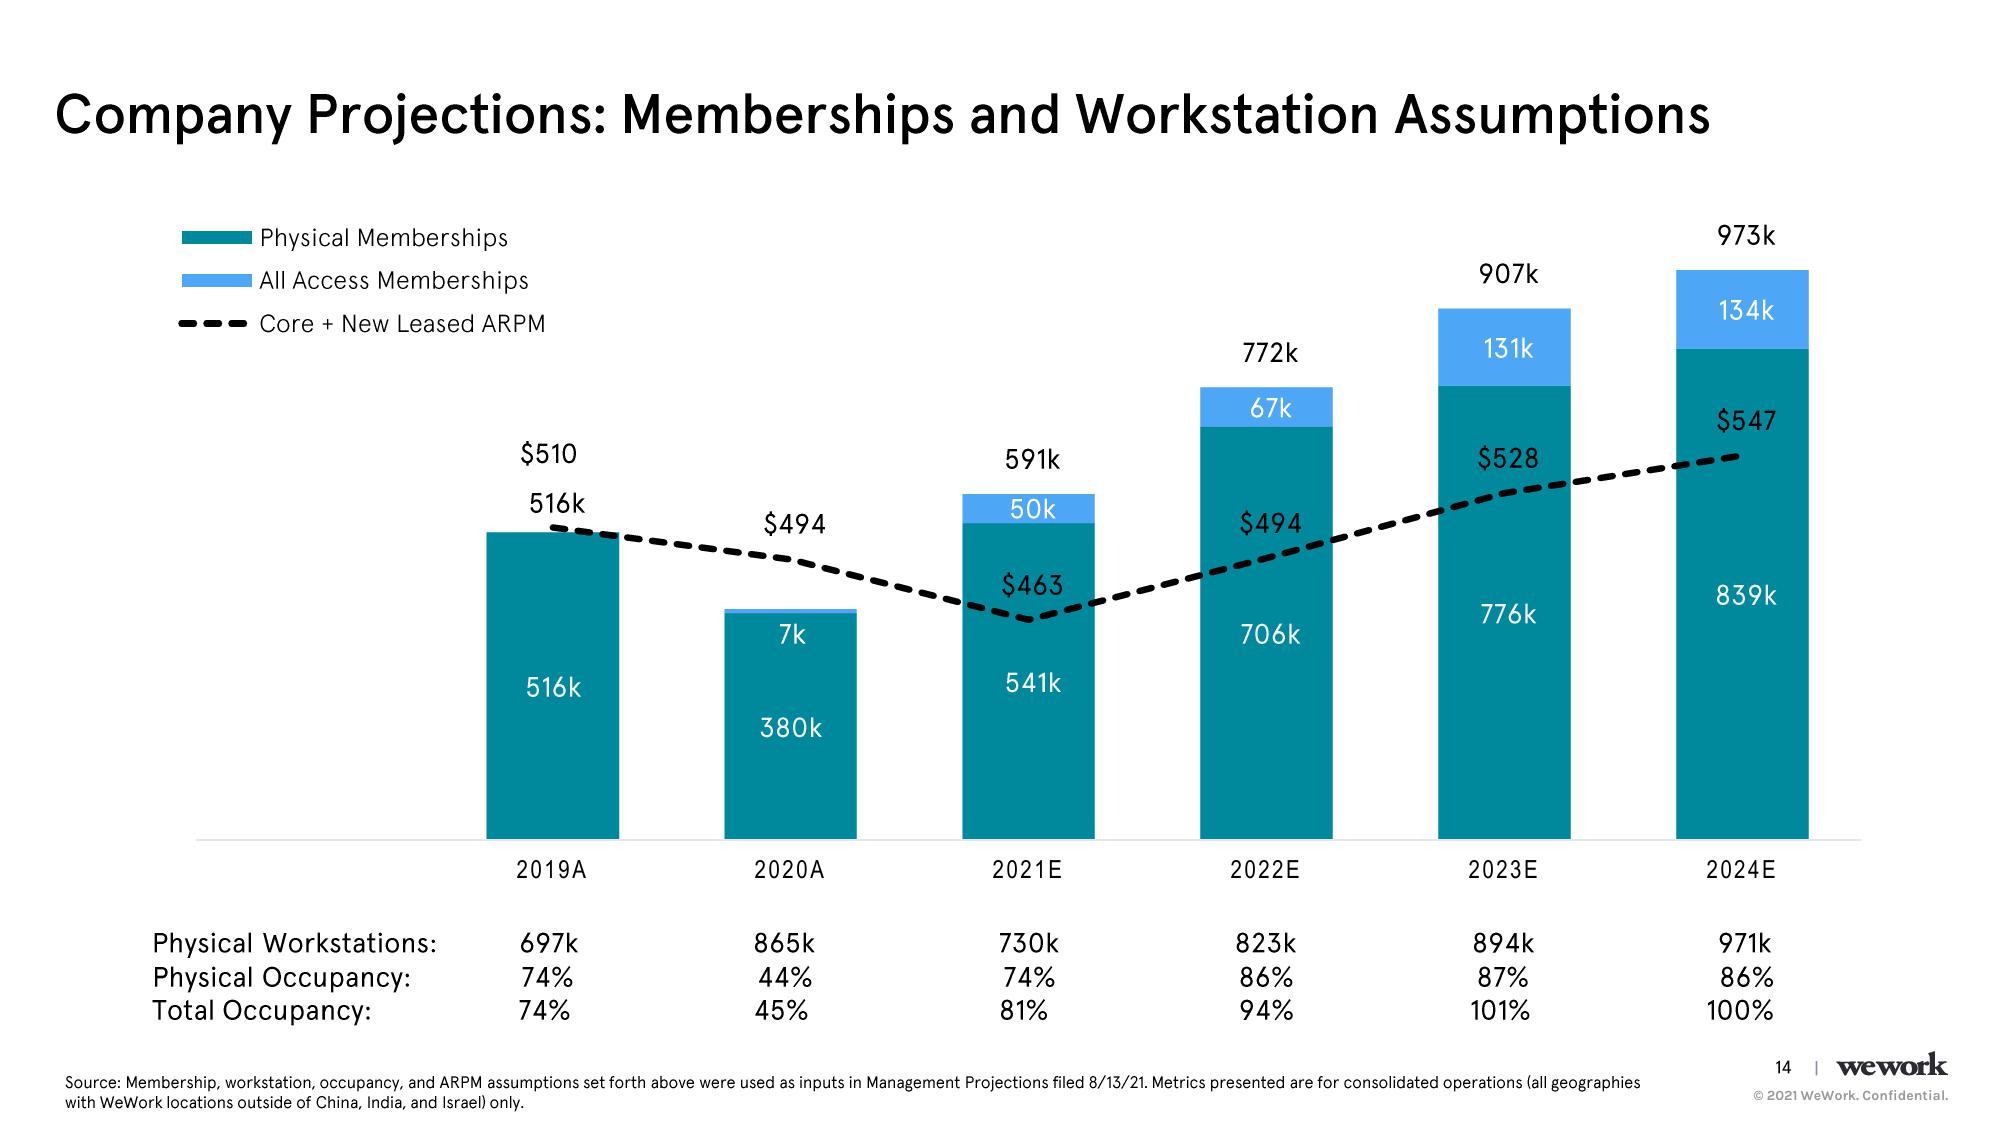
Company Projections: Memberships and Workstation Assumptions Physical Memberships All Access Memberships Core New Leased ARPM Physical Workstations: Physical Occupancy: Total Occupancy: $510 516k 516k 2019A 697k 74% 74% $494 7k 380k 2020A 865k 44% 45% 591k 50k $463 541k 2021E 730k 74% 81% 772k 67k $494 706k 2022E 823k 86% 94% 907k 131k $528 776k 2023E 894k 87% 101% Source: Membership, workstation, occupancy, and ARPM assumptions set forth above were used as inputs in Management Projections filed 8/13/21. Metrics presented are for consolidated operations (all geographies with WeWork locations outside of China, India, and Israel) only. 973k 134k $547 839k 2024E 971k 86% 100% 14 | wework Ⓒ2021 WeWork. Confidential.
View entire presentation