Silicon Valley Bank Results Presentation Deck
Non-GAAP reconciliation*
Capital ratios
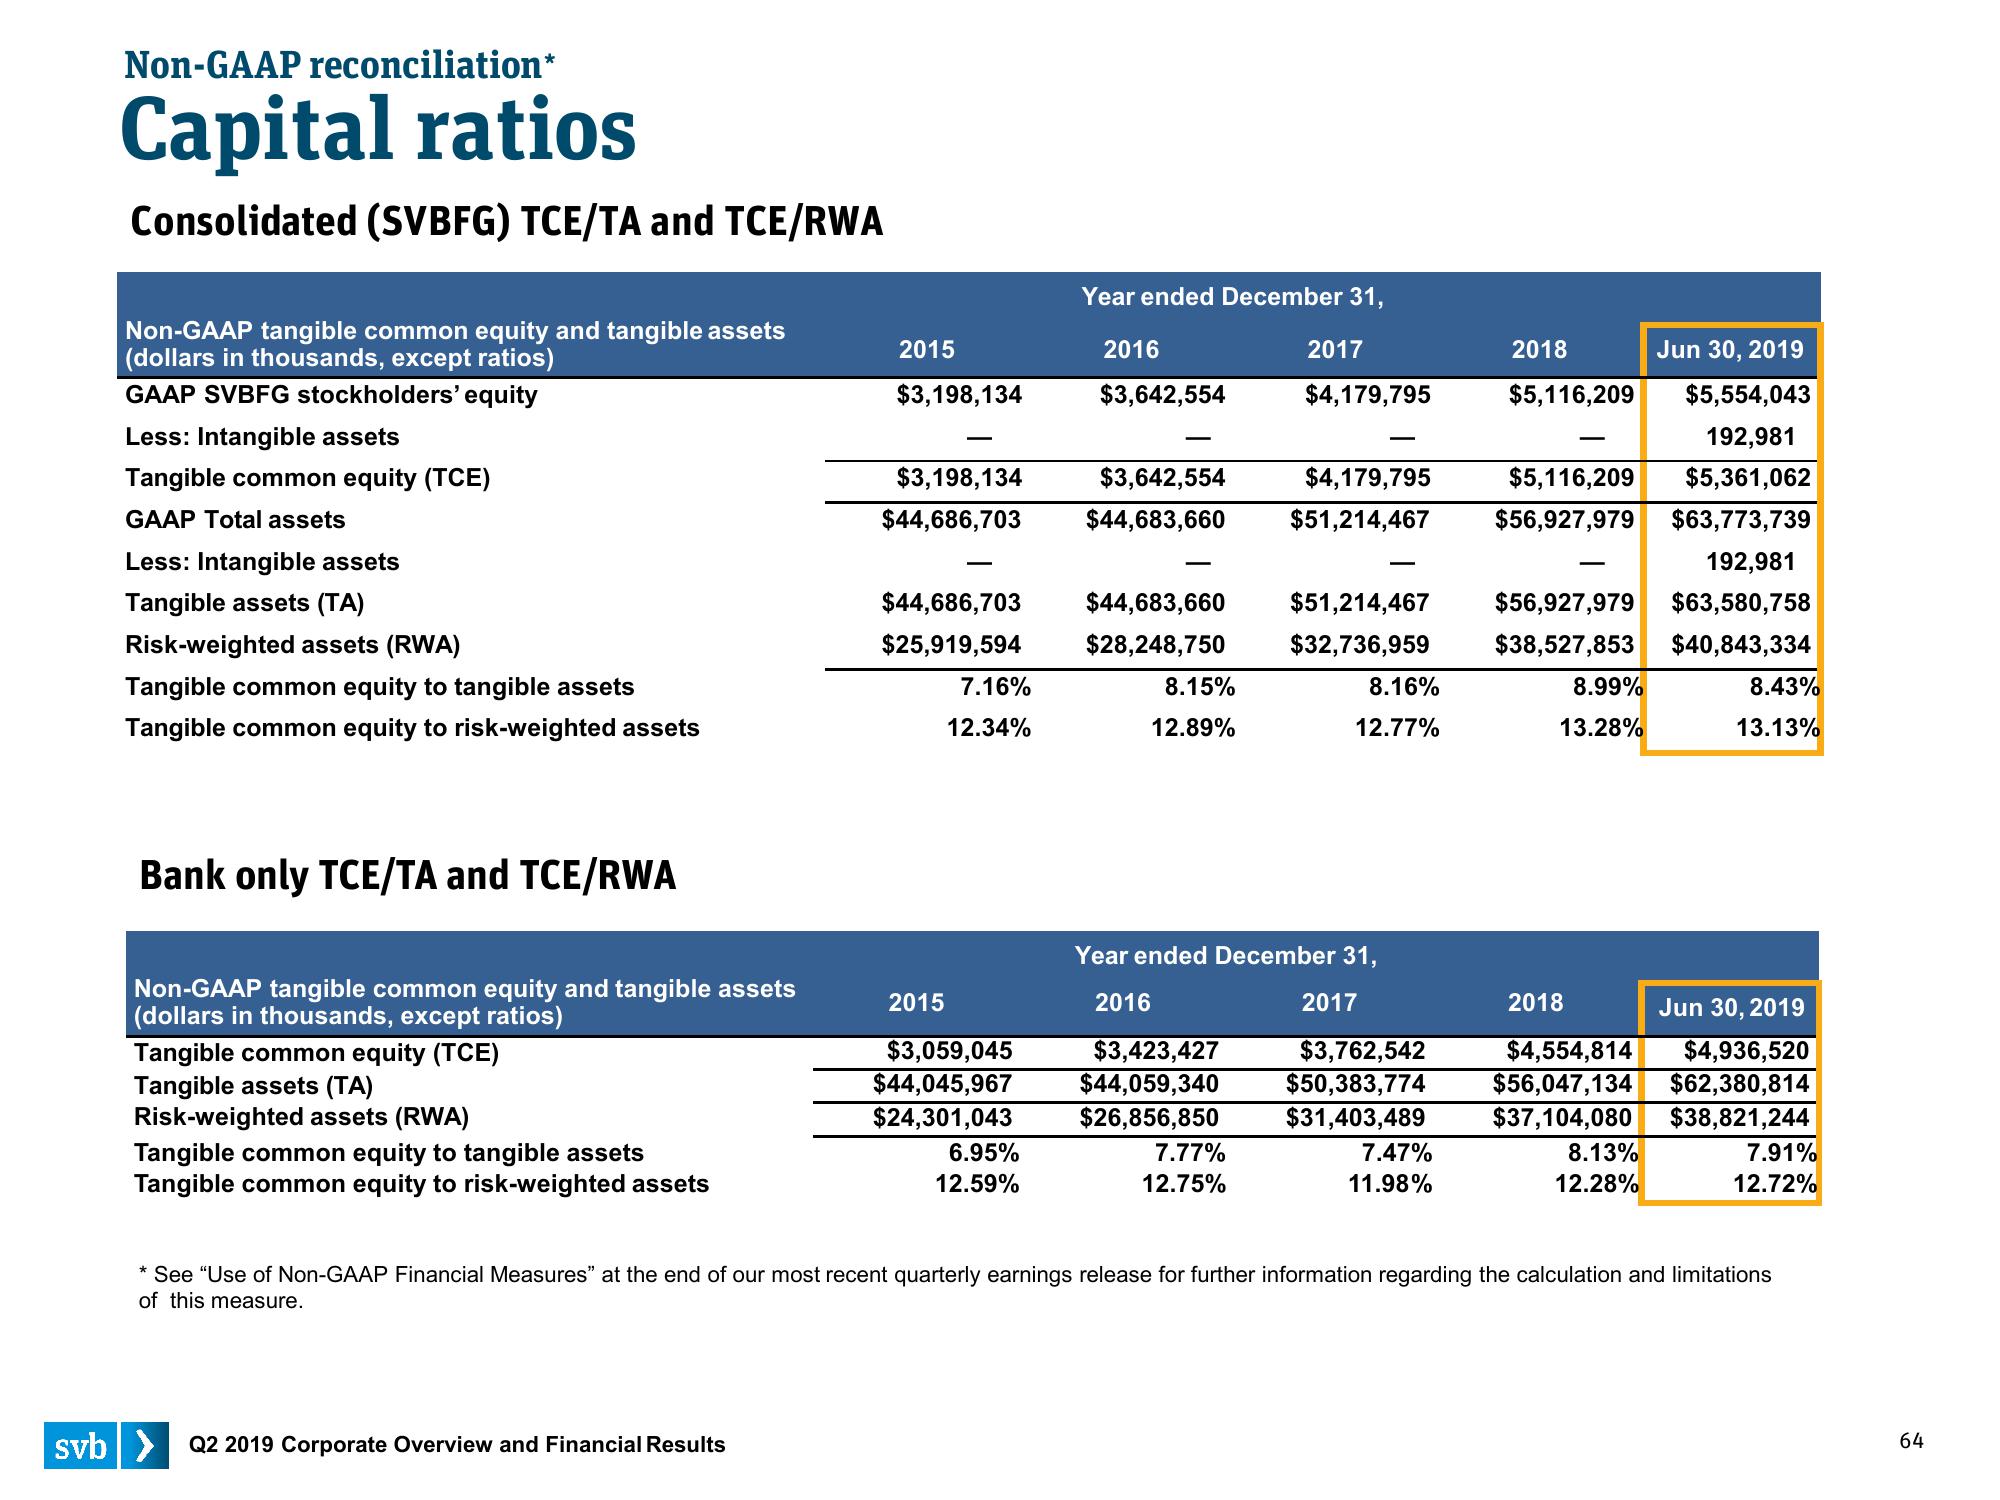
Consolidated (SVBFG) TCE/TA and TCE/RWA
Non-GAAP tangible common equity and tangible assets
(dollars in thousands, except ratios)
GAAP SVBFG stockholders' equity
Less: Intangible assets
Tangible common equity (TCE)
GAAP Total assets
Less: Intangible assets
Tangible assets (TA)
Risk-weighted assets (RWA)
Tangible common equity to tangible assets
Tangible common equity to risk-weighted assets
Bank only TCE/TA and TCE/RWA
Non-GAAP tangible common equity and tangible assets
(dollars in thousands, except ratios)
Tangible common equity (TCE)
Tangible assets (TA)
Risk-weighted assets (RWA)
Tangible common equity to tangible assets
Tangible common equity to risk-weighted assets
2015
svb> Q2 2019 Corporate Overview and Financial Results
$3,198,134
$3,198,134
$44,686,703
$44,686,703
$25,919,594
2015
7.16%
12.34%
$3,059,045
$44,045,967
$24,301,043
6.95%
12.59%
Year ended December 31,
2016
$3,642,554
$3,642,554
$44,683,660
$44,683,660
$28,248,750
8.15%
12.89%
$3,423,427
$44,059,340
$26,856,850
2017
$4,179,795
7.77%
12.75%
$4,179,795
$51,214,467
$51,214,467
$32,736,959
Year ended December 31,
2016
2017
8.16%
12.77%
$3,762,542
$50,383,774
$31,403,489
7.47%
11.98%
Jun 30, 2019
$5,554,043
192,981
$5,116,209 $5,361,062
$56,927,979 $63,773,739
192,981
$56,927,979 $63,580,758
$38,527,853 $40,843,334
2018
$5,116,209
8.99%
13.28%
2018
8.43%
13.13%
$4,554,814
Jun 30, 2019
$4,936,520
$62,380,814
$56,047,134
$37,104,080 $38,821,244
7.91%
8.13%
12.28%
12.72%
* See "Use of Non-GAAP Financial Measures" at the end of our most recent quarterly earnings release for further information regarding the calculation and limitations
of this measure.
64View entire presentation