Newsight Imaging SPAC
Revenue
Multiple
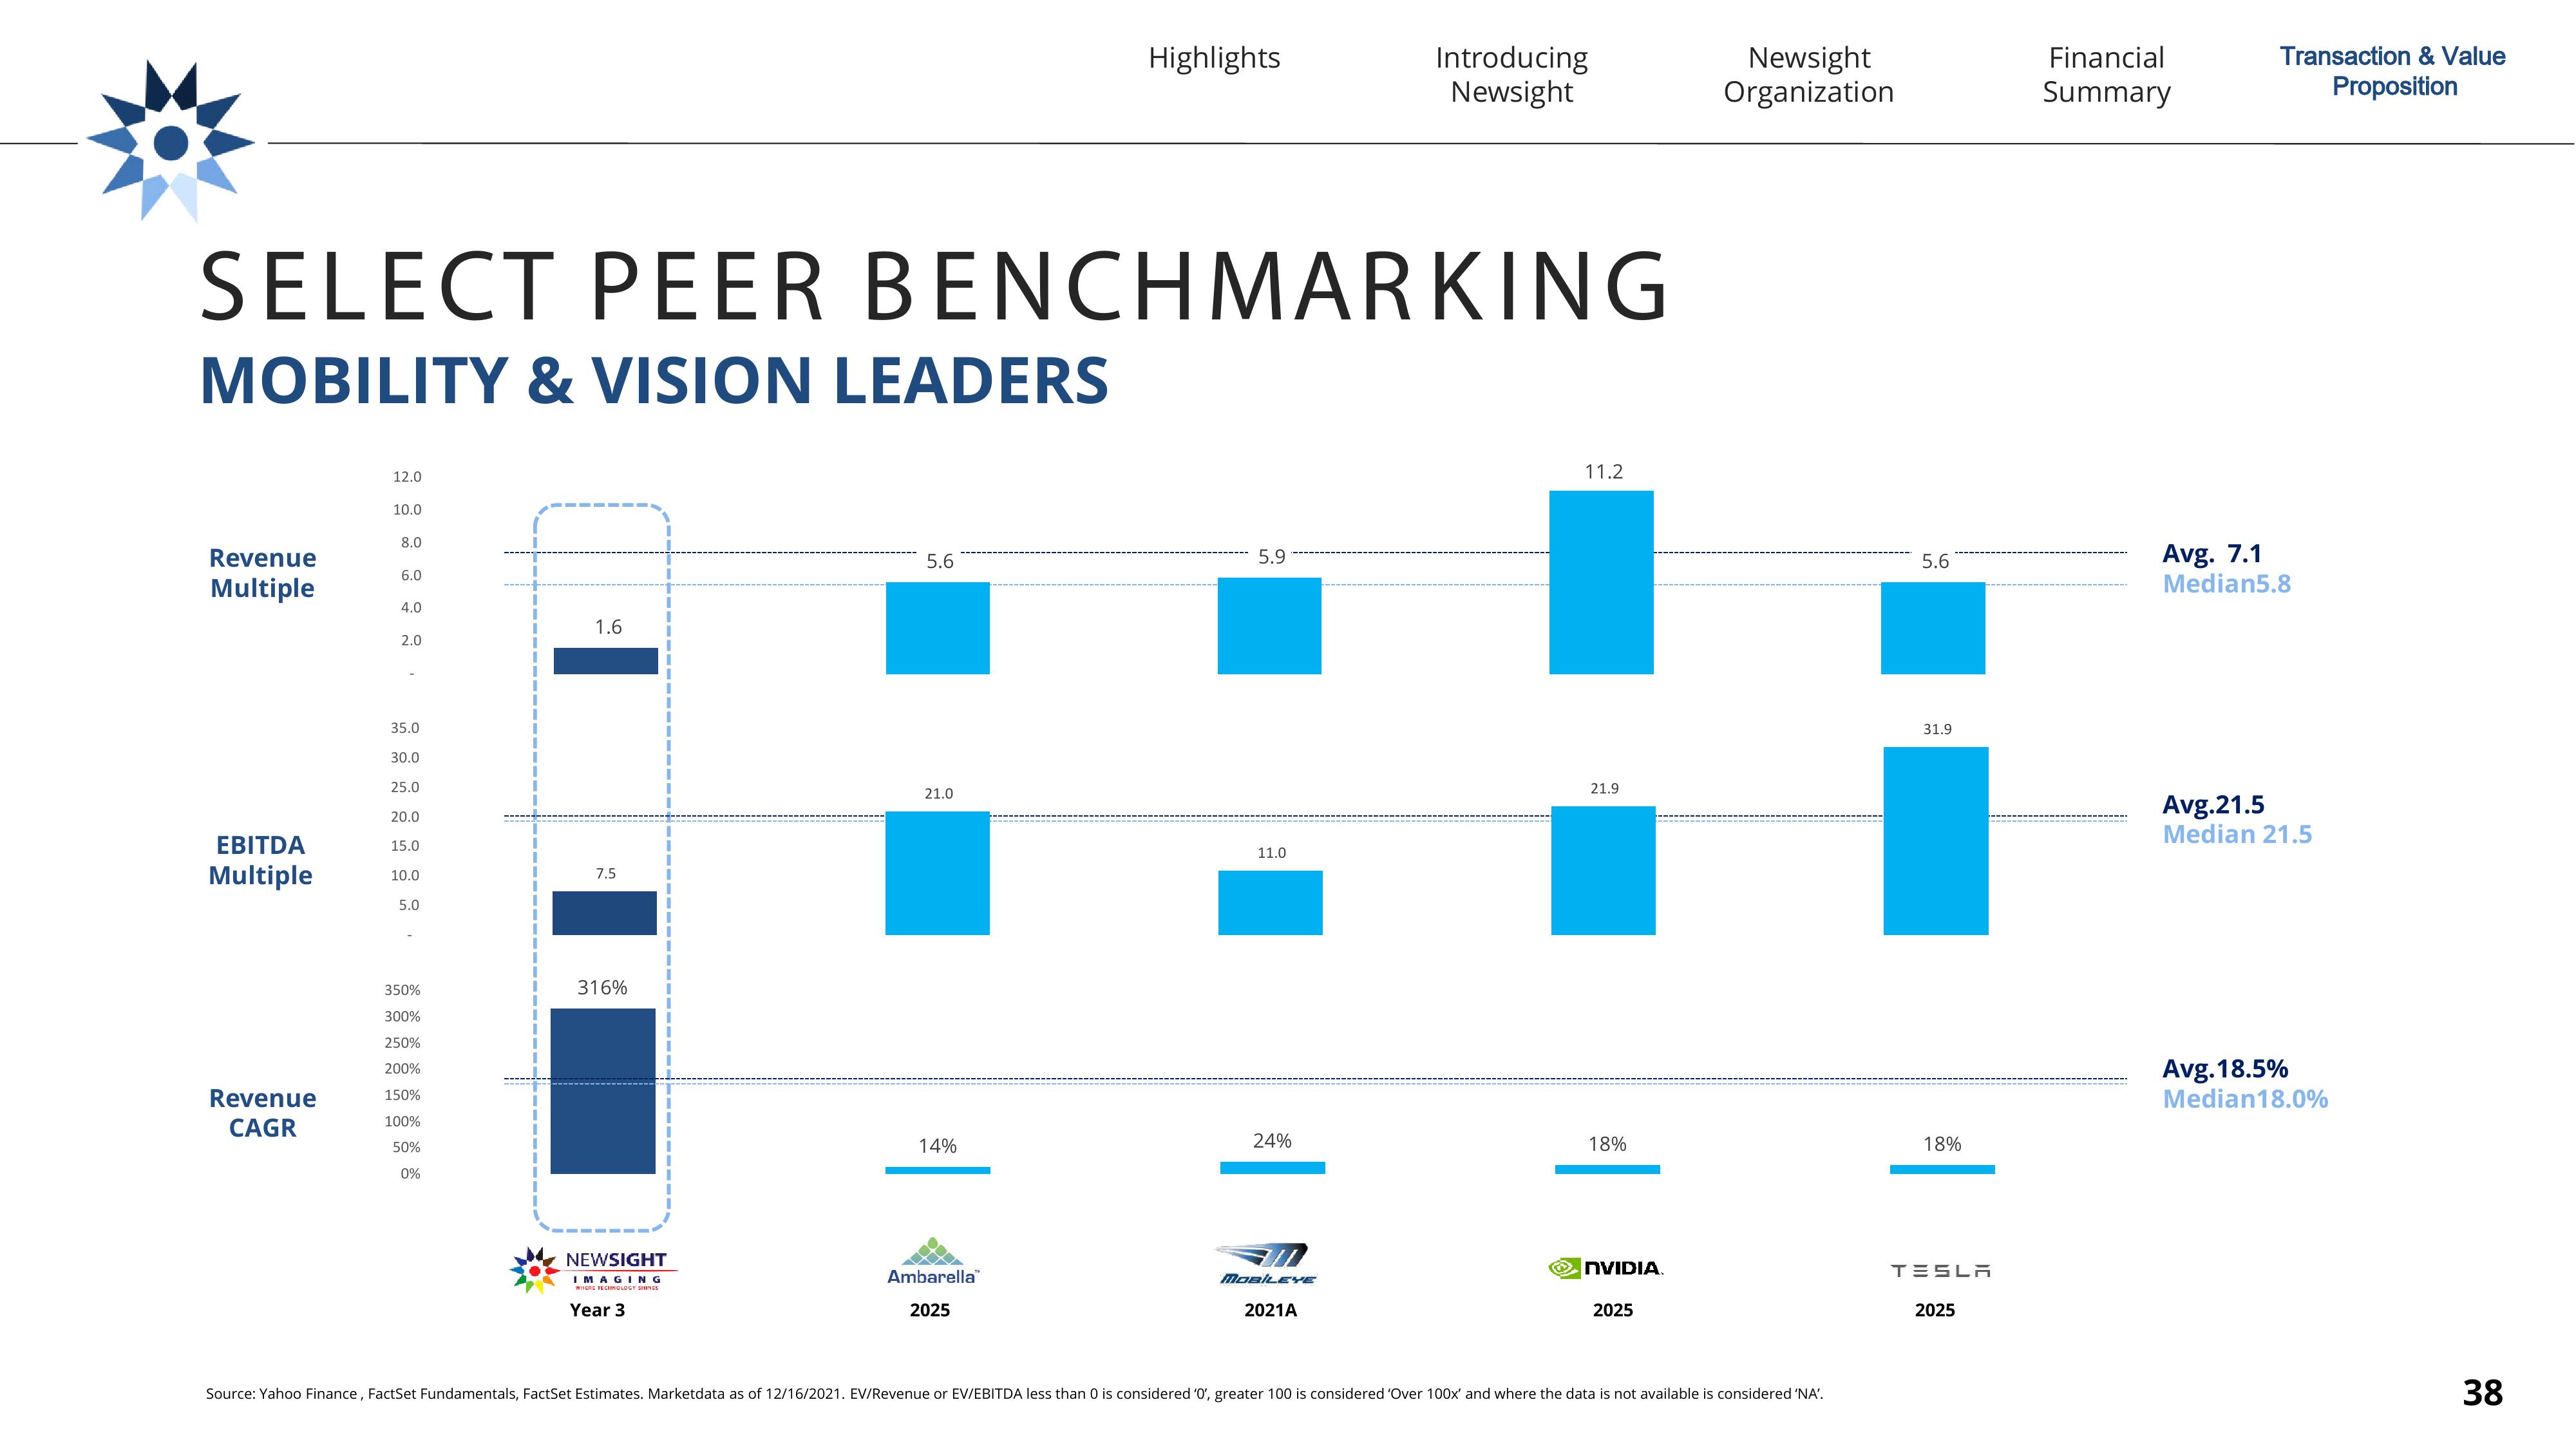
SELECT PEER BENCHMARKING
MOBILITY & VISION LEADERS
EBITDA
Multiple
Revenue
CAGR
12.0
10.0
8.0
6.0
4.0
2.0
35.0
30.0
25.0
20.0
15.0
10.0
5.0
350%
300%
250%
200%
150%
100%
50%
0%
1.6
7.5
316%
NEWSIGHT
IMAGING
Year 3
5.6
21.0
14%
|
Highlights
Ambarella
2025
5.9
11.0
24%
Introducing
Newsight
MOBILEVE
2021A
11.2
21.9
18%
NVIDIA.
2025
Newsight
Organization
Source: Yahoo Finance, FactSet Fundamentals, FactSet Estimates. Marketdata as of 12/16/2021. EV/Revenue or EV/EBITDA less than 0 is considered '0', greater 100 is considered 'Over 100x' and where the data is not available is considered 'NA'.
5.6
31.9
18%
TESLA
2025
Financial
Summary
Transaction & Value
Proposition
Avg. 7.1
Median5.8
Avg.21.5
Median 21.5
Avg.18.5%
Median18.0%
38View entire presentation