AstraZeneca Results Presentation Deck
Total Revenue ($m)
Q3 dynamics
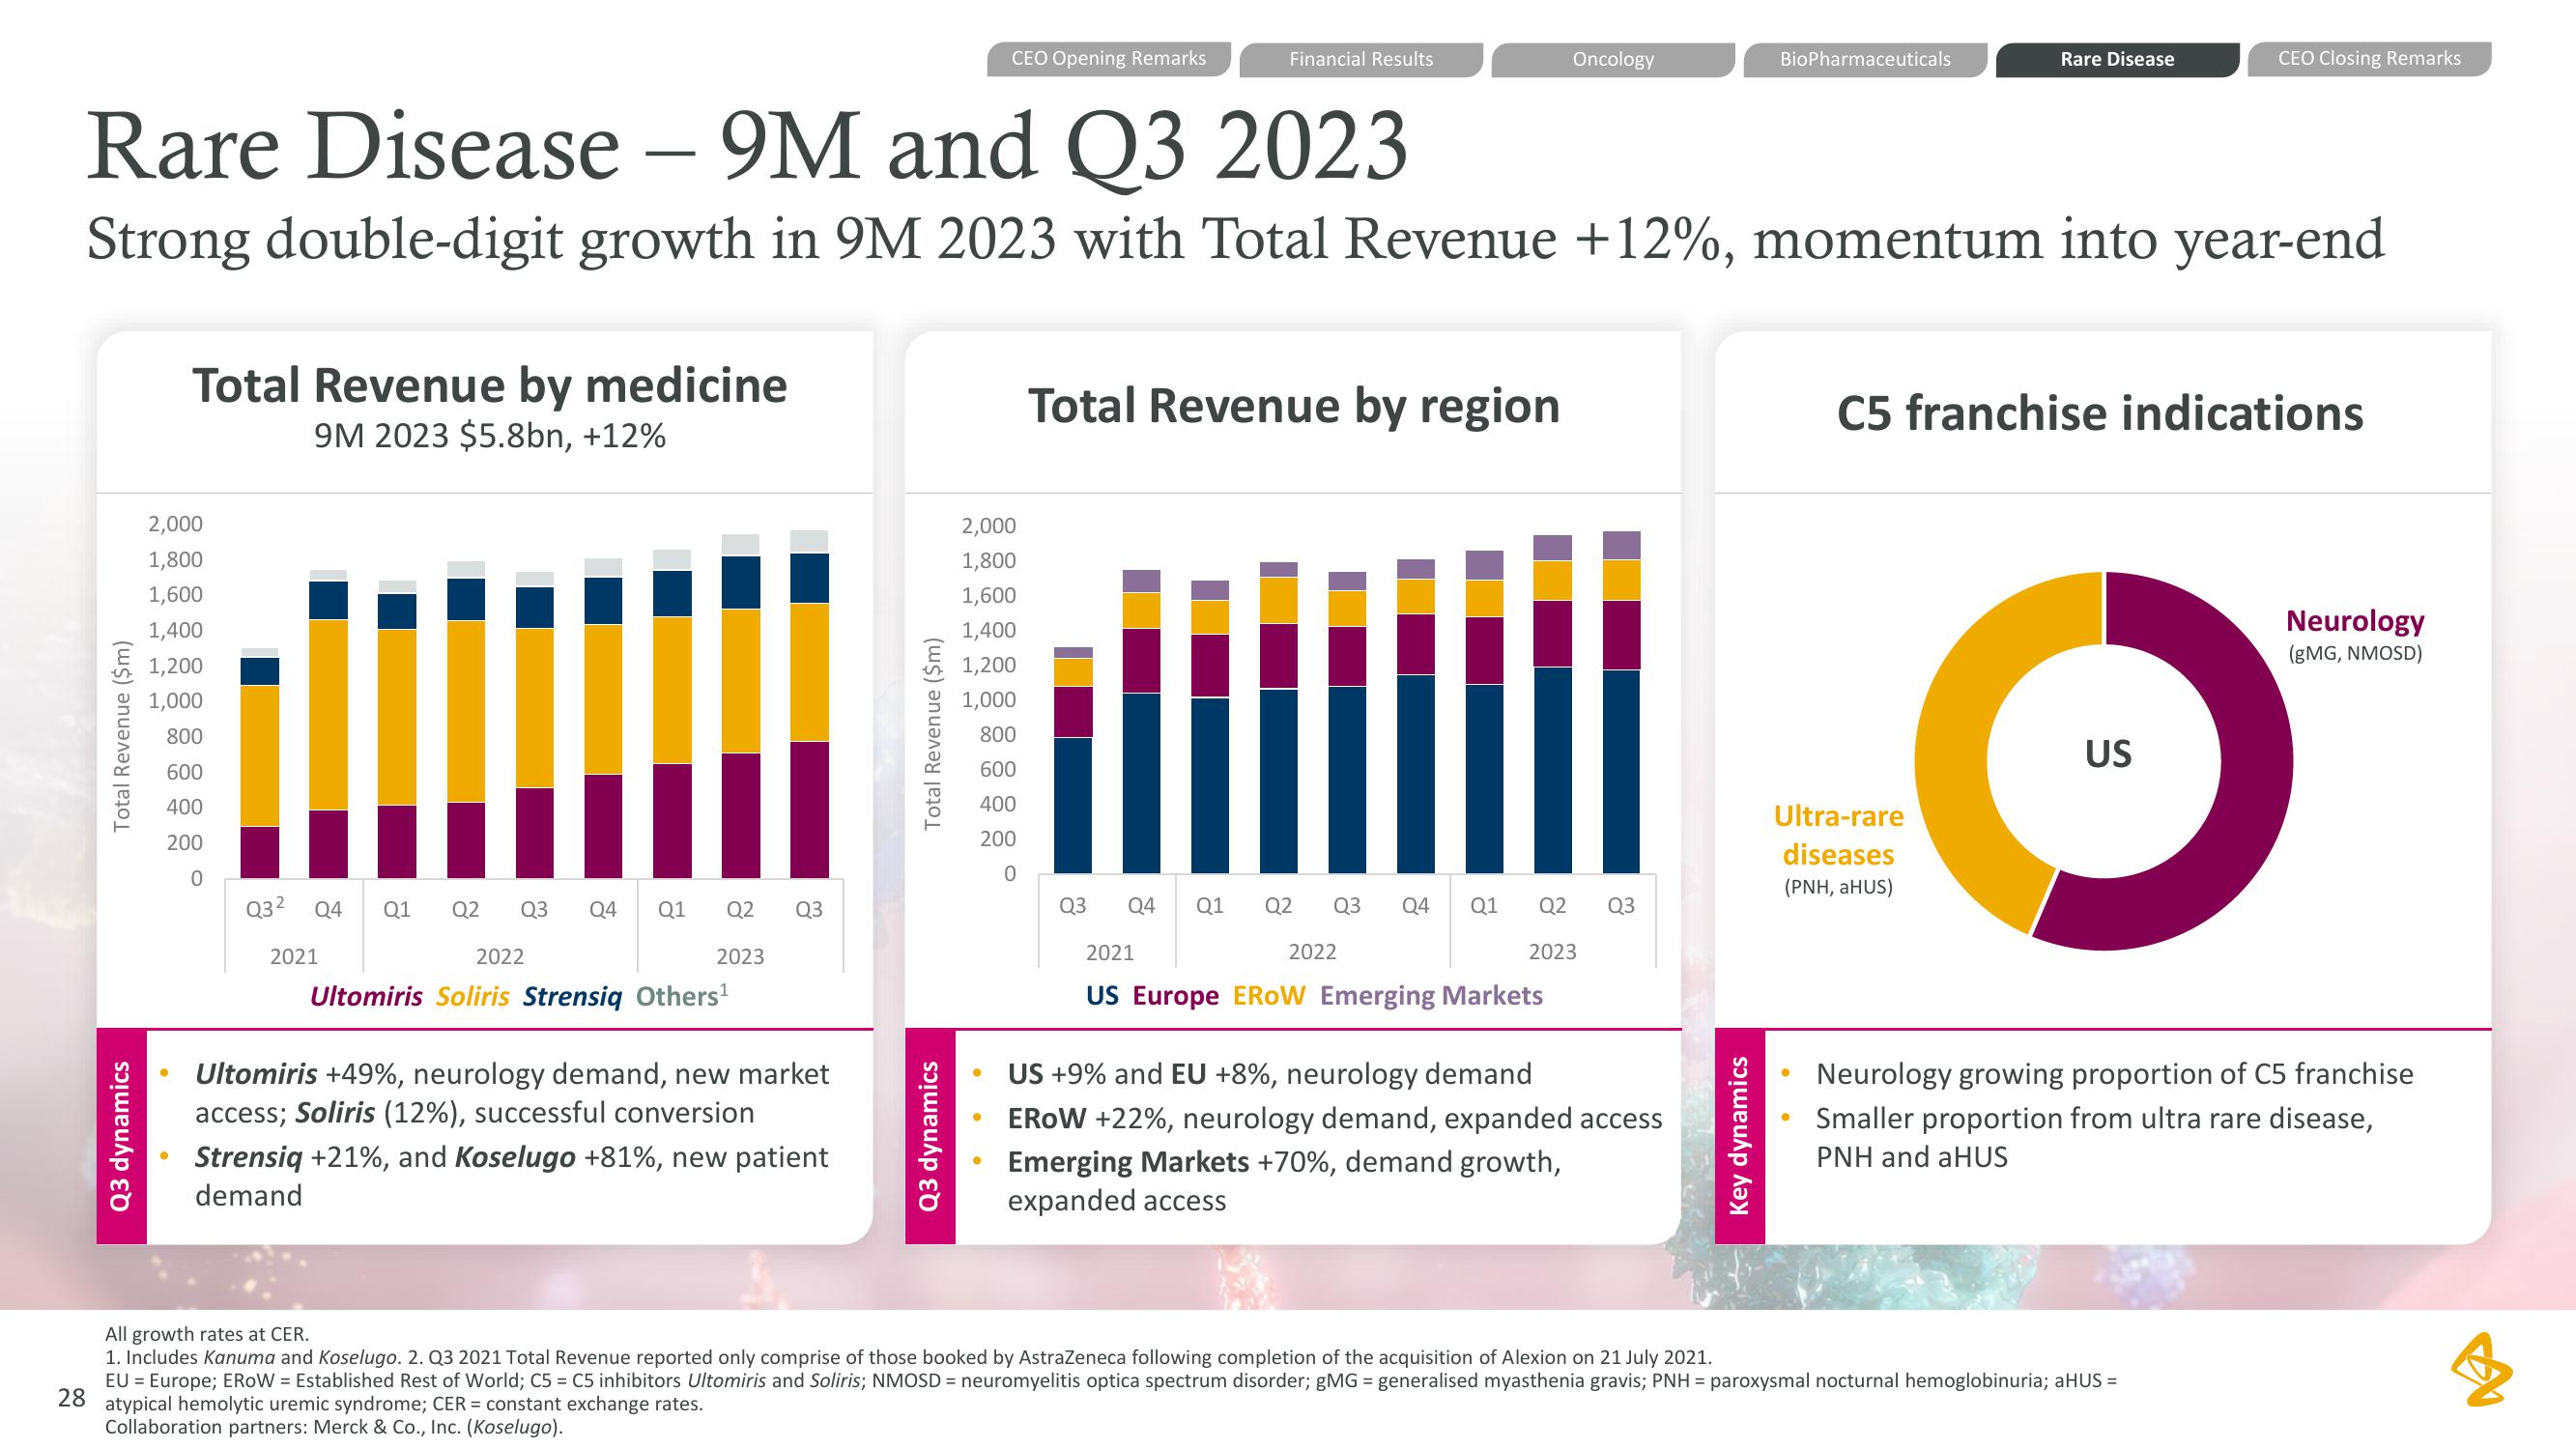
Total Revenue by medicine
9M 2023 $5.8bn, +12%
2,000
1,800
1,600
1,400
1,200
1,000
800
600
400
200
0
Q3² Q4 Q1 Q2 Q3 Q4 Q1
Rare Disease - 9M and Q3 2023
Strong double-digit growth in 9M 2023 with Total Revenue +12%, momentum into year-end
2021
2022
Q2
2023
Ultomiris Soliris Strensiq Others¹
Q3.
Ultomiris +49%, neurology demand, new market
access; Soliris (12%), successful conversion
Strensiq +21%, and Koselugo +81%, new patient
demand
Total Revenue ($m)
CEO Opening Remarks
Q3 dynamics
2,000
1,800
1,600
1,400
1,200
1,000
800
600
400
200
0
Financial Results
Total Revenue by region
Q3
Oncology
Q4 Q1 Q2 Q3 Q4 Q1 Q2 Q3
2021
US Europe EROW Emerging Markets
2022
2023
US +9% and EU +8%, neurology demand
EROW +22%, neurology demand, expanded access
Emerging Markets +70%, demand growth,
expanded access
BioPharmaceuticals
Key dynamics
Rare Disease
Ultra-rare
diseases
(PNH, aHUS)
C5 franchise indications
CEO Closing Remarks
US
All growth rates at CER.
1. Includes Kanuma and Koselugo. 2. Q3 2021 Total Revenue reported only comprise of those booked by AstraZeneca following completion of the acquisition of Alexion on 21 July 2021.
EU = Europe; EROW= Established Rest of World; C5 = C5 inhibitors Ultomiris and Soliris; NMOSD = neuromyelitis optica spectrum disorder; gMG = generalised myasthenia gravis; PNH = paroxysmal nocturnal hemoglobinuria; aHUS =
28
atypical hemolytic uremic syndrome; CER = constant exchange rates.
Collaboration partners: Merck & Co., Inc. (Koselugo).
Neurology
(gMG, NMOSD)
Neurology growing proportion of C5 franchise
Smaller proportion from ultra rare disease,
PNH and aHUSView entire presentation